About the CoMSES Model Library more info
Our mission is to help computational modelers develop, document, and share their computational models in accordance with community standards and good open science and software engineering practices. Model authors can publish their model source code in the Computational Model Library with narrative documentation as well as metadata that supports open science and emerging norms that facilitate software citation, computational reproducibility / frictionless reuse, and interoperability. Model authors can also request private peer review of their computational models. Models that pass peer review receive a DOI once published.
All users of models published in the library must cite model authors when they use and benefit from their code.
Please check out our model publishing tutorial and feel free to contact us if you have any questions or concerns about publishing your model(s) in the Computational Model Library.
We also maintain a curated database of over 7500 publications of agent-based and individual based models with detailed metadata on availability of code and bibliometric information on the landscape of ABM/IBM publications that we welcome you to explore.
Displaying 7 of 7 results network science clear search
Network Behaviour Diffusion
Jennifer Badham | Published Saturday, October 02, 2021This model implements two types of network diffusion from an initial group of activated nodes. In complex contagion, a node is activated if the proportion of neighbour nodes that are already activated exceeds a given threshold. This is intended to represented the spread of health behaviours. In simple contagion, an activated node has a given probability of activating its inactive neighbours and re-tests each time step until all of the neighbours are activated. This is intended to represent information spread.
A range of networks are included with the model from secondary school friendship networks. The proportion of nodes initially activated and the method of selecting those nodes are controlled by the user.
Homophily as a process generating social networks: insights from Social Distance Attachment model
Szymon Talaga Andrzej Nowak | Published Tuesday, September 17, 2019This is code repository for the paper “Homophily as a process generating social networks: insights from Social Distance Attachment model”.
It provides all information, code and data necessary to replicate all the simulations and analyses presented in the paper.
This document contains the overall instruction as well as description of the content of the repository.
Details regarding particular stages are documented within source files as comments.
MERCURY extension: population
Tom Brughmans | Published Thursday, May 23, 2019This model is an extended version of the original MERCURY model (https://www.comses.net/codebases/4347/releases/1.1.0/ ) . It allows for experiments to be performed in which empirically informed population sizes of sites are included, that allow for the scaling of the number of tableware traders with the population of settlements, and for hypothesised production centres of four tablewares to be used in experiments.
Experiments performed with this population extension and substantive interpretations derived from them are published in:
Hanson, J.W. & T. Brughmans. In press. Settlement scale and economic networks in the Roman Empire, in T. Brughmans & A.I. Wilson (ed.) Simulating Roman Economies. Theories, Methods and Computational Models. Oxford: Oxford University Press.
…
MERCURY extension: transport-cost
Tom Brughmans | Published Monday, July 23, 2018This is extended version of the MERCRUY model (Brughmans 2015) incorporates a ‘transport-cost’ variable, and is otherwise unchanged. This extended model is described in this publication: Brughmans, T., 2019. Evaluating the potential of computational modelling for informing debates on Roman economic integration, in: Verboven, K., Poblome, J. (Eds.), Structural Determinants in the Roman World.
Brughmans, T., 2015. MERCURY: an ABM of tableware trade in the Roman East. CoMSES Comput. Model Libr. URL https://www.comses.net/codebases/4347/releases/1.1.0/
Network formation on a two-layer multiplex with shocks
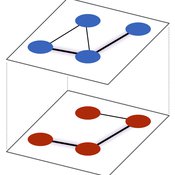
Paul Smaldino | Published Monday, November 27, 2017A dynamic model of social network formation on single-layer and multiplex networks with structural incentives that vary over time.
Multi Asset Variable Network Stock Market Model
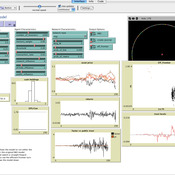
Matthew Oldham | Published Monday, September 12, 2016 | Last modified Tuesday, October 10, 2017An artifcal stock market model that allows users to vary the number of risky assets as well as the network topology that investors forms in an attempt to understand the dynamics of the market.
MERCURY: an ABM of tableware trade in the Roman East
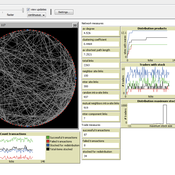
Tom Brughmans Jeroen Poblome | Published Thursday, September 25, 2014 | Last modified Friday, May 01, 2015MERCURY aims to represent and explore two descriptive models of the functioning of the Roman trade system that aim to explain the observed strong differences in the wideness of distributions of Roman tableware.


