About the CoMSES Model Library more info
Our mission is to help computational modelers develop, document, and share their computational models in accordance with community standards and good open science and software engineering practices. Model authors can publish their model source code in the Computational Model Library with narrative documentation as well as metadata that supports open science and emerging norms that facilitate software citation, computational reproducibility / frictionless reuse, and interoperability. Model authors can also request private peer review of their computational models. Models that pass peer review receive a DOI once published.
All users of models published in the library must cite model authors when they use and benefit from their code.
Please check out our model publishing tutorial and feel free to contact us if you have any questions or concerns about publishing your model(s) in the Computational Model Library.
We also maintain a curated database of over 7500 publications of agent-based and individual based models with detailed metadata on availability of code and bibliometric information on the landscape of ABM/IBM publications that we welcome you to explore.
Displaying 9 of 9 results None clear search
Peer reviewed WaDemEsT-Water Demand Estimation Tool for Residential Areas
Kamil Aybuğa | Published Tuesday, February 18, 2025This model simulates household water consumption patterns in an urban environment. Its current setup compares monthly water consumption data, and the results of a daily heuristic water demand model with the simulation results produced by household demographics that is fine tuned via some base demand model. It’s designed to estimate and analyze water demand based on various factors including household demographics, daily routines of residents (working, weekending, vacation patterns), weather conditions (temperature and precipitation), appliance usage patterns, seasonal variations, and special periods such as weekends and holidays. The model aims to help understand how different factors influence residential water consumption and can be used for water demand forecasting and management.
BarterNet is a platform for modeling early barter networks with the aim of learning how supply and demand for a good determine if traders will learn to use that good as a form of money. Traders use a good as money when they offer to trade for it even if they can’t consume it, but believe that they can subsequently trade it for a good they can consume in the near future.
Evaluate government policies for farmers’ adoption and synergy in improving irrigation systems
Amir Hajimirzajan | Published Sunday, February 25, 2024The ABM model is designed to model the adaptability of farmers in DTIM. This model includes two groups of farmers and local government admins agents. Farmers with different levels, with low WP of DTIM, are looking for economic benefits and reduced irrigation and production costs. Meanwhile, the government is looking for strategic goals to maintain water resources’ sustainability. The local government admins employ incentives (subsidies in this study) to encourage farmers to DTIM. In addition, it is used as a tool for supervision and training farmers’ performance. Farmers are currently harvesting water resources with irrigation systems and different levels of technology, and they intend to provide short-term benefits. Farmers adjust the existing approach based on their knowledge of the importance of DTIM and propensity to increase WP and cost-benefit evaluation. DTIM has an initial implementation fee. Every farmer can increase WP by using government subsidies. If none of the farmers create optimal use of water resources, access to water resources will be threatened in the long term. This is considered a hypothetical cost for farmers who do not participate in DTIM. With DTIM, considering that local government admins’ facilities cover an essential part of implementation costs, farmers may think of profiting from local government admins’ facilities by selling that equipment, especially if the farmers in the following conditions may consider selling their developed irrigation equipment. In this case, the technology of their irrigation system will return to the state before development.
- When the threshold of farmers’ propensity to DTIM is low (for example, in the conditions of scarcity of access to sufficient training about the new irrigation system or its role in reducing the cost and sustainability of water resources)
- When the share of government subsidy is high, and as a result, the profit from the sale of equipment is attractive, especially in conditions of inflation.
- Finally, farmers’ honesty threshold should be reduced based on the positive experience of profit-seeking and deception among neighbors.
Increasing the share of government subsidies can encourage farmers to earn profits. Therefore, the government can help increase farmers’ profits by considering the assessment teams at different levels with DTIM training . local government admins evaluations monitor the behavior of farmers. If farmers sell their improved irrigation system for profit, they may be deprived of some local government admins’ services and the possibility of receiving subsidies again. Assessments The local government admins can increase farmers’ honesty. Next, the ABM model evaluates local government admins policies to achieve a suitable framework for water resources management in the Miandoab region.
Space colonization
allagonne | Published Wednesday, January 05, 2022Agent-Based-Modeling - space colonization
ask me for the .nlogo model
WHAT IS IT?
The goal of this project is to simulate with NetLogo (v6.2) a space colonization of humans, starting from Earth, into the Milky Way.
HOW IT WORKS
…
Peer reviewed Are Countertrade credits as flexible and efficient as cash? A novel approach to reducing income inequality using countertrade methodology.
Peter Malliaros | Published Monday, May 03, 2021 | Last modified Tuesday, May 11, 2021The impacts of income inequality can be seen everywhere, regardless of the country or the level of economic development. According to the literature review, income inequality has negative impacts in economic, social, and political variables. Notwithstanding of how well or not countries have done in reducing income inequality, none have been able to reduce it to a Gini Coefficient level of 0.2 or less.
This is the promise that a novel approach called Counterbalance Economics (CBE) provides without the need of increased taxes.
Based on the simulation, introducing the CBE into the Australian, UK, US, Swiss or German economies would result in an overall GDP increase of under 1% however, the level of inequality would be reduced from an average of 0.33 down to an average of 0.08. A detailed explanation of how to use the model, software, and data dependencies along with all other requirements have been included as part of the info tab in the model.
Model of communication between two groups of managers in the course of project implementation
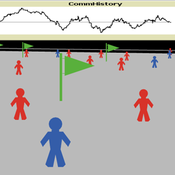
Smarzhevskiy Ivan | Published Monday, December 07, 2020This is a simulation model of communication between two groups of managers in the course of project implementation. The “world” of the model is a space of interaction between project participants, each of which belongs either to a group of work performers or to a group of customers. Information about the progress of the project is publicly available and represents the deviation Earned value (EV) from the planned project value (cost baseline).
The key elements of the model are 1) persons belonging to a group of customers or performers, 2) agents that are communication acts. The life cycle of persons is equal to the time of the simulation experiment, the life cycle of the communication act is 3 periods of model time (for the convenience of visualizing behavior during the experiment). The communication act occurs at a specific point in the model space, the coordinates of which are realized as random variables. During the experiment, persons randomly move in the model space. The communication act involves persons belonging to a group of customers and a group of performers, remote from the place of the communication act at a distance not exceeding the value of the communication radius (MaxCommRadius), while at least one representative from each of the groups must participate in the communication act. If none are found, the communication act is not carried out. The number of potential communication acts per unit of model time is a parameter of the model (CommPerTick).
The managerial sense of the feedback is the stimulating effect of the positive value of the accumulated communication complexity (positive background of the project implementation) on the productivity of the performers. Provided there is favorable communication (“trust”, “mutual understanding”) between the customer and the contractor, it is more likely that project operations will be performed with less lag behind the plan or ahead of it.
The behavior of agents in the world of the model (change of coordinates, visualization of agents’ belonging to a specific communicative act at a given time, etc.) is not informative. Content data are obtained in the form of time series of accumulated communicative complexity, the deviation of the earned value from the planned value, average indicators characterizing communication - the total number of communicative acts and the average number of their participants, etc. These data are displayed on graphs during the simulation experiment.
The control elements of the model allow seven independent values to be varied, which, even with a minimum number of varied values (three: minimum, maximum, optimum), gives 3^7 = 2187 different variants of initial conditions. In this case, the statistical processing of the results requires repeated calculation of the model indicators for each grid node. Thus, the set of varied parameters and the range of their variation is determined by the logic of a particular study and represents a significant narrowing of the full set of initial conditions for which the model allows simulation experiments.
…
00b SimEvo_V5.08 NetLogo
Garvin Boyle | Published Saturday, October 05, 2019In 1985 Dr Michael Palmiter, a high school teacher, first built a very innovative agent-based model called “Simulated Evolution” which he used for teaching the dynamics of evolution. In his model, students can see the visual effects of evolution as it proceeds right in front of their eyes. Using his schema, small linear changes in the agent’s genotype have an exponential effect on the agent’s phenotype. Natural selection therefore happens quickly and effectively. I have used his approach to managing the evolution of competing agents in a variety of models that I have used to study the fundamental dynamics of sustainable economic systems. For example, here is a brief list of some of my models that use “Palmiter Genes”:
- ModEco - Palmiter genes are used to encode negotiation strategies for setting prices;
- PSoup - Palmiter genes are used to control both motion and metabolic evolution;
- TpLab - Palmiter genes are used to study the evolution of belief systems;
- EffLab - Palmiter genes are used to study Jevon’s Paradox, EROI and other things.
…
Peer reviewed DogFoxCDVspillover
Aniruddha Belsare Matthew Gompper | Published Thursday, March 16, 2017 | Last modified Tuesday, April 04, 2017The purpose of this model is to better understand the dynamics of a multihost pathogen in two host system comprising of high densities of domestic hosts and sympatric wildlife hosts susceptible to the pathogen.
The Travel-tour case study
Christophe Sibertin-Blanc Françoise Adreit Joseph El Gemayel | Published Sunday, May 19, 2013 | Last modified Friday, June 14, 2013This model describes and analyses the Travel-Tour Case study.


