Our mission is to help computational modelers develop, document, and share their computational models in accordance with community standards and good open science and software engineering practices. Model authors can publish their model source code in the Computational Model Library with narrative documentation as well as metadata that supports open science and emerging norms that facilitate software citation, computational reproducibility / frictionless reuse, and interoperability. Model authors can also request private peer review of their computational models. Models that pass peer review receive a DOI once published.
All users of models published in the library must cite model authors when they use and benefit from their code.
Please check out our model publishing tutorial and feel free to contact us if you have any questions or concerns about publishing your model(s) in the Computational Model Library.
Displaying 10 of 450 results for "Therese Lindahl" clear search
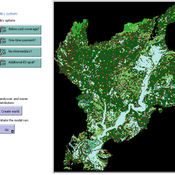
SESPES: socio-ecological systems and payment for ecosystem services model
Eulàlia Baulenas | Published Sunday, December 20, 2020 | Last modified Sunday, December 20, 2020The purpose of this spatially-explicit agent-based model is to intervene in the debate about PES policy design, implementation and context. We use the case for a woodland-for-water payment for ecosystem services (PES) and model its implementation in a local area of Catalonia (NE Spain). The model is based on three sub-models. The structural contains four different designs of a PES policy. The social sub-model includes agent-based factors, by having four types of landowner categories managing or not the forests. This sub-model is based on behavioral studies and assumptions about reception and reaction to incentive policies from European-focused studies. The ecological sub-model is based on climate change data for the area. The output are the evolution of the ecological and social goals of the policy under different policy design scenarios. Our focus in Europe surges from the general context of land abandonment that many Mediterranean areas and Eastern countries are experiencing, and the growing interest from policy-makers and practitioners on the implementation of PES schemes to ameliorate this situation.
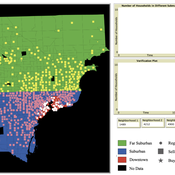
While the world’s total urban population continues to grow, not all cities are witnessing such growth, some are actually shrinking. This shrinkage causes several problems to emerge including population loss, economic depression, vacant properties and the contraction of housing markets. Such problems challenge efforts to make cities sustainable. While there is a growing body of work on study shrinking cities, few explore such a phenomenon from the bottom up using dynamic computational models. To overcome this issue this paper presents an spatially explicit agent-based model stylized on the Detroit Tri-county area, an area witnessing shrinkage. Specifically, the model demonstrates how through the buying and selling of houses can lead to urban shrinkage from the bottom up. The model results indicate that along with the lower level housing transactions being captured, the aggregated level market conditions relating to urban shrinkage are also captured (i.e., the contraction of housing markets). As such, the paper demonstrates the potential of simulation to explore urban shrinkage and potentially offers a means to test polices to achieve urban sustainability.
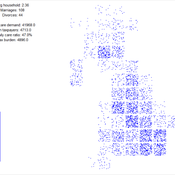
Simulating the cost of social care in an ageing population
Eric Silverman | Published Thursday, September 16, 2021This model is an agent-based simulation written in Python 2.7, which simulates the cost of social care in an ageing UK population. The simulation incorporates processes of population change which affect the demand for and supply of social care, including health status, partnership formation, fertility and mortality. Fertility and mortality rates are drawn from UK population data, then projected forward to 2050 using the methods developed by Lee and Carter 1992.
The model demonstrates that rising life expectancy combined with lower birthrates leads to growing social care costs across the population. More surprisingly, the model shows that the oft-proposed intervention of raising the retirement age has limited utility; some reductions in costs are attained initially, but these reductions taper off beyond age 70. Subsequent work has enhanced and extended this model by adding more detail to agent behaviours and familial relationships.
The version of the model provided here produces outputs in a format compatible with the GEM-SA uncertainty quantification software by Kennedy and O’Hagan. This allows sensitivity analyses to be performed using Gaussian Process Emulation.
Agent-Based Model of Social Care with Kinship Networks
Umberto Gostoli Eric Silverman | Published Thursday, October 14, 2021The purpose of this model is the simulation of social care provision in the UK, in which individual agents can decide to provide informal care, or pay for private care, for their loved ones. Agents base these decisions on factors including their own health, employment status, financial resources, relationship to the individual in need and geographical location. The model simulates care provision as a negotiation process conducted between agents across their kinship networks, with agents with stronger familial relationships to the recipient being more likely to attempt to allocate time to care provision. The model also simulates demographic change, the impact of socioeconomic status, and allows agents to relocate and change jobs or reduce working hours in order to provide care.
Despite the relative lack of empirical data in this model, the model is able to reproduce plausible patterns of social care provision. The inclusion of detailed economic and behavioural mechanisms allows this model to serve as a useful policy development tool; complex behavioural interventions can be implemented in simulation and tested on a virtual population before applying them in real-world contexts.
User Guide and Templates for RAT-RS (a reporting standard for improving the documentation of data use in agent-based modelling)
Melania Borit Edmund Chattoe-Brown Peer-Olaf Siebers Sebastian Achter | Published Saturday, March 12, 2022The Rigor and Transparency Reporting Standard (RAT-RS) is a tool to improve the documentation of data use in Agent-Based Modelling. Following the development of reporting standards for models themselves, attention to empirical models has now reached a stage where these standards need to take equally effective account of data use (which until now has tended to be an afterthought to model description). It is particularly important that a standard should allow the reporting of the different uses to which data may be put (specification, calibration and validation), but also that it should be compatible with the integration of different kinds of data (for example statistical, qualitative, ethnographic and experimental) sometimes known as mixed methods research.
For the full details on the RAT-RS, please refer to the related publication “RAT-RS: A Reporting Standard for Improving the Documentation of Data Use in Agent-Based Modelling” (http://dx.doi.org/10.1080/13645579.2022.2049511).
Here we provide supplementary material for this article, consisting of a RAT-RS user guide and RAT-RS templates.
BEEHAVE Extension: Varroa mite control within Good Beekeeping Practice in Germany
Volker Grimm Jürgen Groeneveld Isabel Schödl | Published Wednesday, May 25, 2022 | Last modified Monday, November 07, 2022The western honey bee Apis mellifera is the most important pollinator in the world. The biggest threat to managed honey bees is the ectoparasitic mite Varroa destructor and the viruses DWV (Deformed Wing Virus) and APV (Acute Paralysis Virus) it transmits. Untreated honey bee colonies are expected to die within one to three years. This led to the development of strategies for beekeepers to control the Varroa mite in honey bee colonies and ensure the health and survival of their bee colonies, so called Good Beekeeping Practice. The aim of the extension of BEEHAVE was to represent the Good Beekeeping Practice of Varroa control in Germany. The relevant measures within the Varroa control strategies are drone brood removal as a Varroa trap and the treatment of bee colonies with organic acaricides (formic and oxalic acid) to kill the mites. This extension improves BEEHAVE and builds a bridge between beekeepers in practice and in the modelling world. It vastly contributes to the future use of BEEHAVE in beekeeping education in Germany.
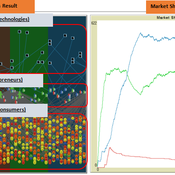
The simulation on the study of the optimal business strategy with the interaction between technologies and consumers.
sej-yoo | Published Monday, June 27, 2022 | Last modified Monday, July 04, 2022HOW IT WORKS
This model consists of three agents, and each agent type operates per business theories as below.
a. New technologies(Tech): It evolves per sustaining or disruptive technology trajectory with the constraint of project management triangle (Scope, Time, Quality, and Cost).
b. Entrepreneurs(Entre): It builds up the solution by combining Tech components per its own strategy (Exploration, Exploitation, or Ambidex).
c. Consumer(Consumer): It selects the solution per its own preference due to Diffusion of innovation theory (Innovators, Early Adopters, Early Majority, Late Majority, Laggards)
…
Peer reviewed Modelling Agricultural Innovations as a Social-Ecological Phenomenon
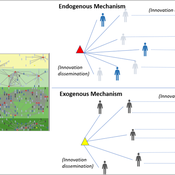
Maja Schlüter Udita Sanga | Published Thursday, November 17, 2022The goal of the AG-Innovation agent-based model is to explore and compare the effects of two alternative mechanisms of innovation development and diffusion (exogenous, linear and endogenous, non-linear) on emergent properties of food and income distribution and adoption rates of different innovations. The model also assesses the range of conditions under which these two alternative mechanisms would be effective in improving food security and income inequality outcomes. Our modelling questions were: i) How do cross-scalar social-ecological interactions within agricultural innovation systems affect system outcomes of food security and income inequality? ii) Do foreign aid-driven exogenous innovation perpetuate income inequality and food insecurity and if so, under which conditions? iii) Do community-driven endogenous innovations improve food security and income inequality and if so, under which conditions? The Ag-Innovation model is intended to serve as a thinking tool for for the development and testing of hypotheses, generating an understanding of the behavior of agricultural innovation systems, and identifying conditions under which alternated innovation mechanisms would improve food security and income inequality outcomes.
An Agent-Based Model of an Insurance Market driven by Supply and Demand with Imperfectly Estimated Strategies in C#
Rei England | Published Sunday, September 24, 2023This is a simulation of an insurance market where the premium moves according to the balance between supply and demand. In this model, insurers set their supply with the aim of maximising their expected utility gain while operating under imperfect information about both customer demand and underlying risk distributions.
There are seven types of insurer strategies. One type follows a rational strategy within the bounds of imperfect information. The other six types also seek to maximise their utility gain, but base their market expectations on a chartist strategy. Under this strategy, market premium is extrapolated from trends based on past insurance prices. This is subdivided according to whether the insurer is trend following or a contrarian (counter-trend), and further depending on whether the trend is estimated from short-term, medium-term, or long-term data.
Customers are modelled as a whole and allocated between insurers according to available supply. Customer demand is calculated according to a logit choice model based on the expected utility gain of purchasing insurance for an average customer versus the expected utility gain of non-purchase.
Evolutionary Model of Subculture Choice
Diogo Alves | Published Monday, December 19, 2022This is an original model of (sub)culture diffusion.
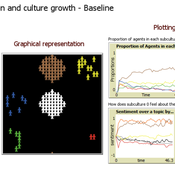
It features a set of agents (dubbed “partygoers”) organized initially in clusters, having properties such as age and a chromosome of opinions about 6 different topics. The partygoers interact with a set of cultures (also having a set of opinions subsuming those of its members), in the sense of refractory or unhappy members of each setting about to find a new culture and trading information encoded in the genetic string (originally encoded as -1, 0, and 1, resp. a negative, neutral, and positive opinion about each of the 6 traits/aspects, e.g. the use of recreational drugs). There are 5 subcultures that both influence (through the aforementioned genetic operations of mutation and recombination of chromosomes simulating exchange of opinions) and are influenced by its members (since a group is a weighted average of the opinions and actions of its constituents). The objective of this feedback loop is to investigate under which conditions certain subculture sizes emerge, but the model is open to many other kinds of explorations as well.
Displaying 10 of 450 results for "Therese Lindahl" clear search