Our mission is to help computational modelers develop, document, and share their computational models in accordance with community standards and good open science and software engineering practices. Model authors can publish their model source code in the Computational Model Library with narrative documentation as well as metadata that supports open science and emerging norms that facilitate software citation, computational reproducibility / frictionless reuse, and interoperability. Model authors can also request private peer review of their computational models. Models that pass peer review receive a DOI once published.
All users of models published in the library must cite model authors when they use and benefit from their code.
Please check out our model publishing tutorial and feel free to contact us if you have any questions or concerns about publishing your model(s) in the Computational Model Library.
Displaying 10 of 126 results for "Brandon Velasco" clear search
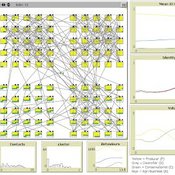
PA/C model with affinity
N. Leticia Abrica-Jacinto Evguenii Kurmyshev Héctor Juárez | Published Thursday, October 27, 2016We expose RA agent-based model of the opinion and tolerance dynamics in artificial societies. The formal mathematical model is based on the ideas of Social Influence, Social Judgment, and Social Identity theories.
Perceived Scientific Value and Impact Factor
Davide Secchi Stephen J Cowley | Published Wednesday, April 12, 2017 | Last modified Monday, January 29, 2018The model explores the impact of journal metrics (e.g., the notorious impact factor) on the perception that academics have of an article’s scientific value.
Exploring social psychology theory for modelling farmer decision-making
James Millington | Published Tuesday, September 18, 2012 | Last modified Saturday, April 27, 2013To investigate the potential of using Social Psychology Theory in ABMs of natural resource use and show proof of concept, we present an exemplary agent-based modelling framework that explicitly represents multiple and hierarchical agent self-concepts
Ant Colony Optimization for infrastructure routing
Igor Nikolic Emile Chappin P W Heijnen | Published Wednesday, March 05, 2014 | Last modified Saturday, March 24, 2018The mode implements a variant of Ant Colony Optimization to explore routing on infrastructures through a landscape with forbidden zones, connecting multiple sinks to one source.
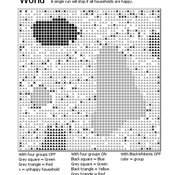
Introducing two extensions of Schelling's segregation model
Andreas Flache Carlos A. de Matos Fernandes | Published Monday, January 25, 2021Schelling famously proposed an extremely simple but highly illustrative social mechanism to understand how strong ethnic segregation could arise in a world where individuals do not necessarily want it. Schelling’s simple computational model is the starting point for our extensions in which we build upon Wilensky’s original NetLogo implementation of this model. Our two NetLogo models can be best studied while reading our chapter “Agent-based Computational Models” (Flache and de Matos Fernandes, 2021). In the chapter, we propose 10 best practices to elucidate how agent-based models are a unique method for providing and analyzing formally precise, and empirically plausible mechanistic explanations of puzzling social phenomena, such as segregation, in the social world. Our chapter addresses in particular analytical sociologists who are new to ABMs.
In the first model (SegregationExtended), we build on Wilensky’s implementation of Schelling’s model which is available in NetLogo library (Wilensky, 1997). We considerably extend this model, allowing in particular to include larger neighborhoods and a population with four groups roughly resembling the ethnic composition of a contemporary large U.S. city. Further features added concern the possibility to include random noise, and the addition of a number of new outcome measures tuned to highlight macro-level implications of the segregation dynamics for different groups in the agent society.
In SegregationDiscreteChoice, we further modify the model incorporating in particular three new features: 1) heterogeneous preferences roughly based on empirical research categorizing agents into low, medium, and highly tolerant within each of the ethnic subgroups of the population, 2) we drop global thresholds (%-similar-wanted) and introduce instead a continuous individual-level single-peaked preference function for agents’ ideal neighborhood composition, and 3) we use a discrete choice model according to which agents probabilistically decide whether to move to a vacant spot or stay in the current spot by comparing the attractiveness of both locations based on the individual preference functions.
…
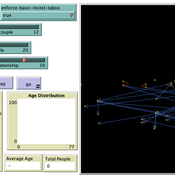
Peer reviewed Monogamous Reproduction in Small Populations and the Enforcement of the Incest Taboo
Ian Stuart | Published Wednesday, January 18, 2023This program was developed to simulate monogamous reproduction in small populations (and the enforcement of the incest taboo).
Every tick is a year. Adults can look for a mate and enter a relationship. Adult females in a Relationship (under the age of 52) have a chance to become pregnant. Everyone becomes not alive at 77 (at which point people are instead displayed as flowers).
User can select a starting-population. The starting population will be adults between the ages of 18 and 42.
…
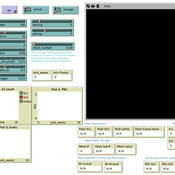
Shellmound Mobility
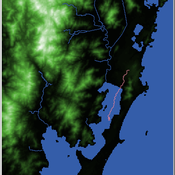
Henrique de Sena Kozlowski | Published Saturday, June 15, 2024Least Cost Path (LCP) analysis is a recurrent theme in spatial archaeology. Based on a cost of movement image, the user can interpret how difficult it is to travel around in a landscape. This kind of analysis frequently uses GIS tools to assess different landscapes. This model incorporates some aspects of the LCP analysis based on GIS with the capabilities of agent-based modeling, such as the possibility to simulate random behavior when moving. In this model the agent will travel around the coastal landscape of Southern Brazil, assessing its path based on the different cost of travel through the patches. The agents represent shellmound builders (sambaquieiros), who will travel mainly through the use of canoes around the lagoons.
How it works?
When the simulation starts the hiker agent moves around the world, a representation of the lagoon landscape of the Santa Catarina state in Southern Brazil. The agent movement is based on the travel cost of each patch. This travel cost is taken from a cost surface raster created in ArcMap to represent the different cost of movement around the landscape. Each tick the agent will have a chance to select the best possible patch to move in its Field of View (FOV) that will take it towards its target destination. If it doesn’t select the best possible patch, it will randomly choose one of the patches to move in its FOV. The simulation stops when the hiker agent reaches the target destination. The elevation raster file and the cost surface map are based on a 1 Arc-second (30m) resolution SRTM image, scaled down 5 times. Each patch represents a square of 150m, with an area of 0,0225km². The dataset uses a UTM Sirgas 2000 22S projection system. There are four different cost functions available to use. They change the cost surface used by the hikers to navigate around the world.
A modified model of breeding synchrony in colonial birds
James Millington | Published Tuesday, June 26, 2012 | Last modified Saturday, April 27, 2013This generic individual-based model of a bird colony shows how the influence neighbour’s stress levels synchronize the laying date of neighbours and also of large colonies. The model has been used to demonstrate how this form of simulation model can be recognised as being ‘event-driven’, retaining a history in the patterns produced via simulated events and interactions.
Linear Threshold
Kaushik Sarkar | Published Saturday, November 03, 2012 | Last modified Saturday, April 27, 2013NetLogo implementation of Linear Threshold model of influence propagation.
Peer reviewed Axelrod_Cultural_Dissemination
Arezky Hernández | Published Wednesday, March 27, 2013 | Last modified Sunday, May 05, 2013The Axelrod’s model of cultural dissemination is an agent-model designed to investigate the dissemination of culture among interacting agents on a society.
Displaying 10 of 126 results for "Brandon Velasco" clear search