About the CoMSES Model Library more info
Our mission is to help computational modelers develop, document, and share their computational models in accordance with community standards and good open science and software engineering practices. Model authors can publish their model source code in the Computational Model Library with narrative documentation as well as metadata that supports open science and emerging norms that facilitate software citation, computational reproducibility / frictionless reuse, and interoperability. Model authors can also request private peer review of their computational models. Models that pass peer review receive a DOI once published.
All users of models published in the library must cite model authors when they use and benefit from their code.
Please check out our model publishing tutorial and feel free to contact us if you have any questions or concerns about publishing your model(s) in the Computational Model Library.
We also maintain a curated database of over 7500 publications of agent-based and individual based models with detailed metadata on availability of code and bibliometric information on the landscape of ABM/IBM publications that we welcome you to explore.
Displaying 10 of 933 results for "Jan Buurma" clear search
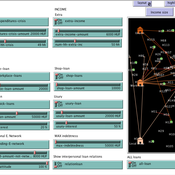
Exploring homeowners' insulation activity
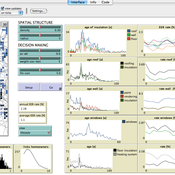
Georg Holtz Emile Chappin Jonas Friege | Published Monday, June 01, 2015 | Last modified Monday, April 08, 2019We built an agent-based model to foster the understanding of homeowners’ insulation activity.
Peer reviewed SWIRS Spread of a woody invader in riparian systems
Moira Zellner Beatriz Sosa Carlos Andrés Chiale | Published Tuesday, May 09, 2023Riparian forests are one of the most vulnerable ecosystems to the development of biological invasions, therefore limiting their spread is one of the main challenges for conservation. The main factors that explain plant invasions in these ecosystems are the capacity for both short- and long-distance seed dispersion, and the occurrence of suitable habitats that facilitate the establishment of the invasive species. Large floods constitute an abiotic filter for invasion.
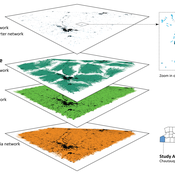
This model simulates the spatio-temporal spread of the woody invader Gleditsia. triacanthos in the riparian forest of the National Park Esteros de Farrapos e Islas del Río Uruguay, a riparian system in the coast of the Uruguay river (South America). In this model, we represent different environmental conditions for the development of G. triacanthos, long- and short-distance spread of its fruits, and large floods as the main factor of mortality for fruit and early stages.
Field results show that the distribution pattern of this invasive species is limited by establishment, i.e. it spreads locally through the expansion of small areas, and remotely through new invasion foci. This model recreates this dispersion pattern. We use this model to derive management implications to control the spread of G. triacanthos
Peer reviewed FISHCODE - FIsheries Simulation with Human COmplex DEcision-making
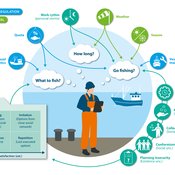
Birgit Müller Gunnar Dressler Jonas Letschert Christian Möllmann Vanessa Stelzenmüller | Published Monday, August 05, 2024FIsheries Simulation with Human COmplex DEcision-making (FISHCODE) is an agent-based model to depict and analyze current and future spatio-temporal dynamics of three German fishing fleets in the southern North Sea. Every agent (fishing vessel) makes daily decisions about if, what, and how long to fish. Weather, fuel and fish prices, as well as the actions of their colleagues influence agents’ decisions. To combine behavioral theories and enable agents to make dynamic decision, we implemented the Consumat approach, a framework in which agents’ decisions vary in complexity and social engagement depending on their satisfaction and uncertainty. Every agent has three satisfactions and two uncertainties representing different behavioral aspects, i.e. habitual behavior, profit maximization, competition, conformism, and planning insecurity. Availability of extensive information on fishing trips allowed us to parameterize many model parameters directly from data, while others were calibrated using pattern oriented modelling. Model validation showed that spatial and temporal aggregated ABM outputs were in realistic ranges when compared to observed data. Our ABM hence represents a tool to assess the impact of the ever growing challenges to North Sea fisheries and provides insight into fisher behavior beyond profit maximization.
How information propagation in hybrid spaces affects decision-making: using ABM to simulate Covid-19 vaccine uptake
Fuzhen Yin | Published Wednesday, March 13, 2024Abstract: The notion of physical space has long been central in geographical theories. However, the widespread adoption of information and communication technologies (ICTs) has freed human dynamics from purely physical to also relational and cyber spaces. While researchers increasingly recognize such shifts, rarely have studies examined how the information propagates in these hybrid spaces (i.e., physical, relational, and cyber). By exploring the vaccine opinion dynamics through agent-based modeling, this study is the first that combines all hybrid spaces and explores their distinct impacts on human dynamics from an individual’s perspective. Our model captures the temporal dynamics of vaccination progress with small errors (MAE=2.45). Our results suggest that all hybrid spaces are indispensable in vaccination decision making. However, in our model, most of the agents tend to give more emphasis to the information that is spread in the physical instead of other hybrid spaces. Our study not only sheds light on human dynamics research but also offers a new lens to identifying vaccinated individuals which has long been challenging in disease-spread models. Furthermore, our study also provides responses for practitioners to develop vaccination outreach policies and plan for future outbreaks.
LogoClim: WorldClim in NetLogo
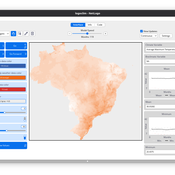
Daniel Vartanian Leandro Garcia Aline Martins de Carvalho Aline | Published Thursday, July 03, 2025 | Last modified Tuesday, September 16, 2025LogoClim is a NetLogo model for simulating and visualizing global climate conditions. It allows researchers to integrate high-resolution climate data into agent-based models, supporting reproducible research in ecology, agriculture, environmental sciences, and other fields that rely on climate data.
The model utilizes raster data to represent climate variables such as temperature and precipitation over time. It incorporates historical data (1951-2024) and future climate projections (2021-2100) derived from global climate models under various Shared Socioeconomic Pathways (SSPs, O’Neill et al., 2017). All climate inputs come from WorldClim 2.1, a widely used source of high-resolution, interpolated climate datasets based on weather station observations worldwide (Fick & Hijmans, 2017).
LogoClim follows the FAIR Principles for Research Software (Barker et al., 2022) and is openly available on the CoMSES Network and GitHub. See the Logônia model for an example of its integration into a full NetLogo simulation.
Peer reviewed Credit and debt market of low-income families
Márton Gosztonyi | Published Tuesday, December 12, 2023 | Last modified Friday, January 19, 2024The purpose of the Credit and debt market of low-income families model is to help the user examine how the financial market of low-income families works.
The model is calibrated based on real-time data which was collected in a small disadvantaged village in Hungary it contains 159 households’ social network and attributes data.
The simulation models the households’ money liquidity, expenses and revenue structures as well as the formal and informal loan institutions based on their network connections. The model forms an intertwined system integrated in the families’ local socioeconomic context through which families handle financial crises and overcome their livelihood challenges from one month to another.
The simulation-based on the abstract model of low-income families’ financial survival system at the bottom of the pyramid, which was described in following the papers:
…
REHAB: A Role Playing Game to Explore the Influence of Knowledge and Communication on Natural Resources Management
Christophe Le Page Anne Dray Pascal Perez Claude Garcia | Published Monday, July 13, 2015 | Last modified Monday, July 13, 2015REHAB has been designed as an ice-breaker in courses dealing with ecosystem management and participatory modelling. It helps introducing the two main tools used by the Companion Modelling approach, namely role-playing games and agent-based models.
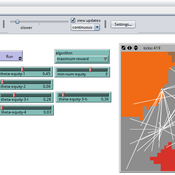
Equity Constrained Dispatching Model of Emergency Medical Services
Sreekanth V K Ram Babu Roy | Published Thursday, September 08, 2016 | Last modified Monday, May 01, 2017Model for evaluating various ambulance dispatching policies of an equity constrained emergency medical services under bounded rationality.
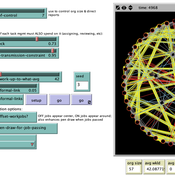
Formal Organization Hierarchy and Informal Networks - "The Company Behind the Org Chart"
Tom Briggs | Published Sunday, April 18, 2021A generalized organizational agent- based model (ABM) containing both formal organizational hierarchy and informal social networks simulates organizational processes that occur over both formal network ties and informal networks.
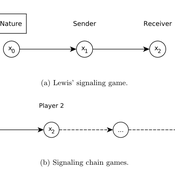
Lewis' Signaling Chains
Giorgio Gosti | Published Wednesday, January 14, 2015 | Last modified Friday, April 03, 2015Signaling chains are a special case of Lewis’ signaling games on networks. In a signaling chain, a sender tries to send a single unit of information to a receiver through a chain of players that do not share a common signaling system.
Displaying 10 of 933 results for "Jan Buurma" clear search
