About the CoMSES Model Library more info
Our mission is to help computational modelers develop, document, and share their computational models in accordance with community standards and good open science and software engineering practices. Model authors can publish their model source code in the Computational Model Library with narrative documentation as well as metadata that supports open science and emerging norms that facilitate software citation, computational reproducibility / frictionless reuse, and interoperability. Model authors can also request private peer review of their computational models. Models that pass peer review receive a DOI once published.
All users of models published in the library must cite model authors when they use and benefit from their code.
Please check out our model publishing tutorial and feel free to contact us if you have any questions or concerns about publishing your model(s) in the Computational Model Library.
We also maintain a curated database of over 7500 publications of agent-based and individual based models with detailed metadata on availability of code and bibliometric information on the landscape of ABM/IBM publications that we welcome you to explore.
Displaying 10 of 211 results Data clear search
Covid-19-Belief-network-Hybrid-Model
Morteza Mahmoudzadeh | Published Sunday, September 05, 2021Digital social networks facilitate the opinion dynamics and idea flow and also provide reliable data to understand these dynamics. Public opinion and cooperation behavior are the key factors to determine the capacity of a successful and effective public policy. In particular, during the crises, such as the Corona virus pandemic, it is necessary to understand the people’s opinion toward a policy and the performance of the governance institutions. The problem of the mathematical explanation of the human behaviors is to simplify and bypass some of the essential process. To tackle this problem, we adopted a data-driven strategy to extract opinion and behavioral patterns from social media content to reflect the dynamics of society’s average beliefs toward different topics. We extracted important subtopics from social media contents and analyze the sentiments of users at each subtopic. Subsequently, we structured a Bayesian belief network to demonstrate the macro patters of the beliefs, opinions, information and emotions which trigger the response toward a prospective policy. We aim to understand the factors and latent factors which influence the opinion formation in the society. Our goal is to enhance the reality of the simulations. To capture the dynamics of opinions at an artificial society we apply agent-based opinion dynamics modeling. We intended to investigate practical implementation scenarios of this framework for policy analysis during Corona Virus Pandemic Crisis. The implemented modular modeling approach could be used as a flexible data-driven policy making tools to investigate public opinion in social media. The core idea is to put the opinion dynamics in the wider contexts of the collective decision-making, data-driven policy-modeling and digital democracy. We intended to use data-driven agent-based modeling as a comprehensive analysis tools to understand the collective opinion dynamics and decision making process on the social networks and uses this knowledge to utilize network-enabled policy modeling and collective intelligence platforms.
ACTING (Affect Control Theory based simulation of Interaction in Networked Groups)
nikozoe | Published Thursday, August 19, 2021This agent-based simulation model for group interaction is rooted in social psychological theory. The
model integrates affect control theory with networked interaction structures and sequential behavior protocols as they are often encountered in task groups. By expressing status hierarchy through network structure we build a bridge between expectation states theory and affect control theory, and are able to reproduce central results from the expectation states research program in sociological social psychology. Furthermore, we demonstrate how the model can be applied to analyze specialized task groups or sub-cultural domains by combining it with empirical data sources. As an example, we simulate groups of open-source software developers and analyze how cultural expectations influence the occupancy of high status positions in these groups.
Model of Rental Evictions in Phoenix During the Covid-19 Pandemic
Sean Bergin J M Applegate | Published Saturday, July 31, 2021 | Last modified Friday, October 15, 2021The purpose of this model is to explore the dynamics of residency and eviction for households renting in the greater Phoenix (Arizona) metropolitan area. The model uses a representative population of renters modified from American Community Survey (ACS) data that includes demographic, housing and economic information. Each month, households pay their subsistence, rental and utility bills. If a household is unable to pay their monthly rent or utility bill they apply for financial assistance. This model provides a platform to understand the impact of various economic shock upon households. Also, the model includes conditions that occurred as a result of the Covid-19 pandemic which allows for the study of eviction mitigation strategies that were employed, such as the eviction moratorium and stimulus payments. The model allows us to make preliminary predictions concerning the number of households that may be evicted once the moratorium on evictions ends and the long-term effects on the number of evicted households in the greater Phoenix area going forward.
SiFlo: An Agent-based Model to simulate inhabitants’ behavior during a flood event
Patrick Taillandier Franck Taillandier Pascal Di Maiolo Rasool Mehdizadeh | Published Thursday, July 29, 2021SiFlo is an ABM dedicated to simulate flood events in urban areas. It considers the water flowing and the reaction of the inhabitants. The inhabitants would be able to perform different actions regarding the flood: protection (protect their house, their equipment and furniture…), evacuation (considering traffic model), get and give information (considering imperfect knowledge), etc. A special care was taken to model the inhabitant behavior: the inhabitants should be able to build complex reasoning, to have emotions, to follow or not instructions, to have incomplete knowledge about the flood, to interfere with other inhabitants, to find their way on the road network. The model integrates the closure of roads and the danger a flooded road can represent. Furthermore, it considers the state of the infrastructures and notably protection infrastructures as dyke. Then, it allows to simulate a dyke breaking.
The model intends to be generic and flexible whereas provide a fine geographic description of the case study. In this perspective, the model is able to directly import GIS data to reproduce any territory. The following sections expose the main elements of the model.
Peer reviewed Small-Trade Model
Emilie Lindkvist Maja Schlüter Blanca Gonzalez-Mon Örjan Bodin | Published Wednesday, July 28, 2021The purpose of this model is to understand the role of trade networks and their interaction with different fish resources, for fish provision. The model is developed based on a multi-methods approach, combining agent-based modeling, network analysis and qualitative data based on a small-scale fisheries study case. The model can be used to investigate both how trade network structures are embedded in a social-ecological context and the trade processes that occur within them, to analyze how they lead to emergent outcomes related to the resilience of fish provision. The model processes are informed by qualitative data analysis, and the social network analysis of an empirical fish trade network. The network analysis can be used to investigate diverse network structures to perform model experiments, and their influence on model outcomes.
The main outcomes we study are 1) the overexploitation of fish resources and 2) the availability and variability of fish provision to satisfy different market demands, and 3) individual traders’ fish supply at the micro-level. The model has two types of trader agents, seller and dealer. The model reveals that the characteristics of the trade networks, linked to different trader types (that have different roles in those networks), can affect the resilience of fish provision.
Holmestrand School Model
Jessica Dimka | Published Friday, June 18, 2021 | Last modified Friday, April 29, 2022The Holmestrand model is an epidemiological agent-based model. Its aim is to test hypotheses related to how the social and physical environment of a residential school for children with disabilities might influence the spread of an infectious disease epidemic among students and staff. Annual reports for the Holmestrand School for the Deaf (Norway) are the primary sources of inspiration for the modeled school, with additional insights drawn from other archival records for schools for children with disabilities in early 20th century Norway and data sources for the 1918 influenza pandemic. The model environment consists of a simplified boarding school that includes residential spaces for students and staff, classrooms, a dining room, common room, and an outdoor area. Students and staff engage in activities reflecting hourly schedules suggested by school reports. By default, a random staff member is selected as the first case and is infected with disease. Subsequent transmission is determined by agent movement and interactions between susceptible and infectious pairs.
Team Cognition
Iris Lorscheid | Published Sunday, May 23, 2021The teamCognition model investigates team decision processes by using an agent-based model to conceptualize team decisions as an emergent property. It uses a mixed-method research design with a laboratory experiment providing qualitative and quantitative input for the model’s construction, as well as data for an output validation of the model. The agent-based model is used as a computational testbed to contrast several processes of team decision making, representing potential, simplified mechanisms of how a team decision emerges. The increasing overall fit of the simulation and empirical results indicates that the modeled decision processes can at least partly explain the observed team decisions.
Peer reviewed Social Consequences of Past Compound Events - Laacher See Eruption
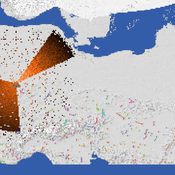
Kevin Su Brennen Bouwmeester | Published Monday, May 17, 2021Resilience of humans in the Upper Paleolithic could provide insights in how to defend against today’s environmental threats. Approximately 13,000 years ago, the Laacher See volcano located in present-day western Germany erupted cataclysmically. Archaeological evidence suggests that this is eruption – potentially against the background of a prolonged cold spell – led to considerable culture change, especially at some distance from the eruption (Riede, 2017). Spatially differentiated and ecologically mediated effects on contemporary social networks as well as social transmission effects mediated by demographic changes in the eruption’s wake have been proposed as factors that together may have led to, in particular, the loss of complex technologies such as the bow-and-arrow (Riede, 2014; Riede, 2009).
This model looks at the impact of the interaction between climate change trajectory and an extreme event, such as the Laacher See eruption, on the generational development of hunter-gatherer bands. Historic data is used to model the distribution and population dynamics of hunter-gatherer bands during these circumstances.
Peer reviewed Are Countertrade credits as flexible and efficient as cash? A novel approach to reducing income inequality using countertrade methodology.
Peter Malliaros | Published Monday, May 03, 2021 | Last modified Tuesday, May 11, 2021The impacts of income inequality can be seen everywhere, regardless of the country or the level of economic development. According to the literature review, income inequality has negative impacts in economic, social, and political variables. Notwithstanding of how well or not countries have done in reducing income inequality, none have been able to reduce it to a Gini Coefficient level of 0.2 or less.
This is the promise that a novel approach called Counterbalance Economics (CBE) provides without the need of increased taxes.
Based on the simulation, introducing the CBE into the Australian, UK, US, Swiss or German economies would result in an overall GDP increase of under 1% however, the level of inequality would be reduced from an average of 0.33 down to an average of 0.08. A detailed explanation of how to use the model, software, and data dependencies along with all other requirements have been included as part of the info tab in the model.
A data-informed bounded-confidence opinion dynamics model
Bruce Edmonds | Published Wednesday, March 10, 2021The simulation is a variant of the “ToRealSim OD variants - base v2.7” base model, which is based on the standard DW opinion dynamics model (but with the differences that rather than one agent per tick randomly influencing another, all agents randomly influence one other per tick - this seems to make no difference to the outcomes other than to scale simulation time). Influence can be made one-way by turning off the two-way? switch
Various additional variations and sources of noise are possible to test robustness of outcomes to these (compared to DW model).
In this version agent opinions change following the empirical data collected in some experiments (Takács et al 2016).
Such an algorithm leaves no role for the uncertainties in other OD models. [Indeed the data from (Takács et al 2016) indicates that there can be influence even when opinion differences are large - which violates a core assumption of these]. However to allow better comparison with other such models there is a with-un? switch which allows uncertainties to come into play. If this is on, then influence (according to above algorithm) is only calculated if the opinion difference is less than the uncertainty. If an agent is influenced uncertainties are modified in the same way as standard DW models.
Displaying 10 of 211 results Data clear search


