Our mission is to help computational modelers develop, document, and share their computational models in accordance with community standards and good open science and software engineering practices. Model authors can publish their model source code in the Computational Model Library with narrative documentation as well as metadata that supports open science and emerging norms that facilitate software citation, computational reproducibility / frictionless reuse, and interoperability. Model authors can also request private peer review of their computational models. Models that pass peer review receive a DOI once published.
All users of models published in the library must cite model authors when they use and benefit from their code.
Please check out our model publishing tutorial and feel free to contact us if you have any questions or concerns about publishing your model(s) in the Computational Model Library.
Displaying 10 of 209 results for "M Vavier" clear search
Model of Rental Evictions in Phoenix During the Covid-19 Pandemic
Sean Bergin J M Applegate | Published Saturday, July 31, 2021 | Last modified Friday, October 15, 2021The purpose of this model is to explore the dynamics of residency and eviction for households renting in the greater Phoenix (Arizona) metropolitan area. The model uses a representative population of renters modified from American Community Survey (ACS) data that includes demographic, housing and economic information. Each month, households pay their subsistence, rental and utility bills. If a household is unable to pay their monthly rent or utility bill they apply for financial assistance. This model provides a platform to understand the impact of various economic shock upon households. Also, the model includes conditions that occurred as a result of the Covid-19 pandemic which allows for the study of eviction mitigation strategies that were employed, such as the eviction moratorium and stimulus payments. The model allows us to make preliminary predictions concerning the number of households that may be evicted once the moratorium on evictions ends and the long-term effects on the number of evicted households in the greater Phoenix area going forward.
WeDiG Sim
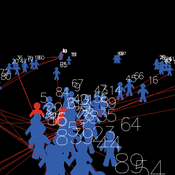
Reza Shamsaee | Published Monday, May 14, 2012 | Last modified Saturday, April 27, 2013WeDiG Sim- Weighted Directed Graph Simulator - is an open source application that serves to simulate complex systems. WeDiG Sim reflects the behaviors of those complex systems that put stress on scale-free, weightedness, and directedness. It has been implemented based on “WeDiG model” that is newly presented in this domain. The WeDiG model can be seen as a generalized version of “Barabási-Albert (BA) model”. WeDiG not only deals with weighed directed systems, but also it can handle the […]
Evolution of Conditional Cooperation
M Manning Marco Janssen Oyita Udiani | Published Thursday, August 01, 2013 | Last modified Friday, May 13, 2022Cultural group selection model used to evaluate the conditions for agents to evolve who have other-regarding preferences in making decisions in public good games.
Imperfect knowledge and stable governance in democracies
Carlos M Fernández-Márquez Francisco Jose Vazquez Luis Fernando Medina | Published Tuesday, February 05, 2019In this paper we introduce an agent-based model of elections and government formation where voters do not have perfect knowledge about the parties’ ideological position. Although voters are boundedly rational, they are forward-looking in that they try to assess the likely impact of the different parties over the resulting government. Thus, their decision rules combine sincere and strategic voting: they form preferences about the different parties but deem some of them as inadmissible and try to block them from office. We find that the most stable and durable coalition governments emerge at intermediate levels of informational ambiguity. When voters have very poor information about the parties, their votes are scattered too widely, preventing the emergence of robust majorities. But also, voters with highly precise perceptions about the parties will cluster around tiny electoral niches with a similar aggregate effect.
Peer reviewed Price Evolution with Expectations
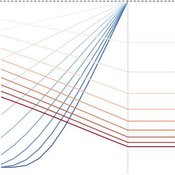
J M Applegate Gesine Steudel Armin Haas Carlo Jaeger | Published Friday, September 10, 2021The Price Evolution with Expectations model provides the opportunity to explore the question of non-equilibrium market dynamics, and how and under which conditions an economic system converges to the classically defined economic equilibrium. To accomplish this, we bring together two points of view of the economy; the classical perspective of general equilibrium theory and an evolutionary perspective, in which the current development of the economic system determines the possibilities for further evolution.
The Price Evolution with Expectations model consists of a representative firm producing no profit but producing a single good, which we call sugar, and a representative household which provides labour to the firm and purchases sugar.The model explores the evolutionary dynamics whereby the firm does not initially know the household demand but eventually this demand and thus the correct price for sugar given the household’s optimal labour.
The model can be run in one of two ways; the first does not include money and the second uses money such that the firm and/or the household have an endowment that can be spent or saved. In either case, the household has preferences for leisure and consumption and a demand function relating sugar and price, and the firm has a production function and learns the household demand over a set number of time steps using either an endogenous or exogenous learning algorithm. The resulting equilibria, or fixed points of the system, may or may not match the classical economic equilibrium.

Peer reviewed HUMLAND FIRE-IN-THE-HOLE agent-based model
Fulco Scherjon Anastasia Nikulina | Published Monday, October 20, 2025HUMLAND Fire-in-the-Hole is a conceptual agent-based model (ABM) designed to explore the ecological and behavioral consequences of fire-driven hunting strategies employed by hunter-gatherers, specifically Neanderthals, during the Last Interglacial period around the Neumark-Nord (Germany) archaeological site.
This model builds on and specializes the HUMLAND 1.0.0 model (Nikulina et al. 2024), integrating anthropogenic fires, elephant group behavior, and landscape response to simulate interactions between humans, megafauna, and vegetation over time.
Peer reviewed Organizational behavior in the hierarchy model
Smarzhevskiy Ivan | Published Tuesday, June 18, 2019 | Last modified Wednesday, July 31, 2019In a two-level hierarchical structure (consisting of the positions of managers and operators), persons holding these positions have a certain performance and the value of their own (personal perception in this, simplified, version of the model) perception of each other. The value of the perception of each other by agents is defined as a random variable that has a normal distribution (distribution parameters are set by the control elements of the interface).
In the world of the model, which is the space of perceptions, agents implement two strategies: rapprochement with agents that perceive positively and distance from agents that perceive negatively (both can be implemented, one of these strategies, or neither, the other strategy, which makes the agent stationary). Strategies are implemented in relation to those agents that are in the radius of perception (PerRadius).
The manager (Head) forms a team of agents. The performance of the group (the sum of the individual productivities of subordinates, weighted by the distance from the leader) varies depending on the position of the agents in space and the values of their individual productivities. Individual productivities, in the current version of the model, are set as a random variable distributed evenly on a numerical segment from 0 to 100. The manager forms the team 1) from agents that are in (organizational) radius (Op_Radius), 2) among agents that the manager perceives positively and / or negatively (both can be implemented, one of the specified rules, or neither, which means the refusal of the command formation).
Agents can (with a certain probability, given by the variable PrbltyOfDecisn%), in case of a negative perception of the manager, leave his group permanently.
It is possible in the model to change on the fly radii values, update the perception value across the entire population and the perception of an individual agent by its neighbors within the perception radius, and the probability values for a subordinate to make a decision about leaving the group.
You can also change the set of strategies for moving agents and strategies for recruiting a team manager. It is possible to add a randomness factor to the movement of agents (Stoch_Motion_Speed, the default is set to 0, that is, there are no random movements).
…
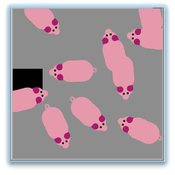
Tail biting behaviour in pigs
Iris J.M.M. Boumans Iris Jmm Boumans | Published Friday, April 22, 2016 | Last modified Wednesday, September 14, 2016The model simulates tail biting behaviour in pigs and how they can turn into a biter and/or victim. The effect of a redirected motivation, behavioural changes in victims and preference to bite a lying pig on tail biting can be tested in the model
Narragansett Bay (RI) Recreational Fishery ABM
Tyler Pavlowich Anne Innes-Gold Margaret Heinichen M. Conor McManus Jason McNamee Jeremy Collie Austin Humphries | Published Monday, June 21, 2021This model is based on the Narragansett Bay, RI recreational fishery. The two types of agents are piscivorous fish and fishers (shore and boat fishers are separate “breeds”). Each time step represents one week. Open season is weeks 1-26, assuming fishing occurs during half the year. At each weekly time step, fish agents grow, reproduce, and die. Fisher agents decide whether or not to fish based on their current satisfaction level, and those that do go fishing attempt to catch a fish. If they are successful, they decide whether to keep or release the fish. In our publication, this model was linked to an Ecopath with Ecosim food web model where the commercial harvest of forage fish affected the biomass of piscivorous fish - which then became the starting number of piscivorous fish for this ABM. The number of fish caught in a season of this ABM was converted to a fishing pressure and input back into the food web model.
Team Structure and Task Performance
Davide Secchi Martin Neumann | Published Monday, August 05, 2024This model was designed to study resilience in organizations. Inspired by ethnographic work, it follows the simple goal to understand whether team structure affects the way in which tasks are performed. In so doing, it compares the ‘hybrid’ data-inspired structure with three more traditional structures (i.e. hierarchy, flexible/relaxed hierarchy, and anarchy/disorganization).
Displaying 10 of 209 results for "M Vavier" clear search