About the CoMSES Model Library more info
Our mission is to help computational modelers develop, document, and share their computational models in accordance with community standards and good open science and software engineering practices. Model authors can publish their model source code in the Computational Model Library with narrative documentation as well as metadata that supports open science and emerging norms that facilitate software citation, computational reproducibility / frictionless reuse, and interoperability. Model authors can also request private peer review of their computational models. Models that pass peer review receive a DOI once published.
All users of models published in the library must cite model authors when they use and benefit from their code.
Please check out our model publishing tutorial and feel free to contact us if you have any questions or concerns about publishing your model(s) in the Computational Model Library.
We also maintain a curated database of over 7500 publications of agent-based and individual based models with detailed metadata on availability of code and bibliometric information on the landscape of ABM/IBM publications that we welcome you to explore.
Displaying 10 of 64 results for "Melanie Swartz" clear search
Peer reviewed Virus Transmission with Super-spreaders
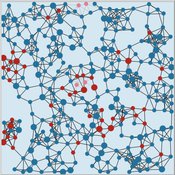
J M Applegate | Published Saturday, September 11, 2021A curious aspect of the Covid-19 pandemic is the clustering of outbreaks. Evidence suggests that 80\% of people who contract the virus are infected by only 19% of infected individuals, and that the majority of infected individuals faile to infect another person. Thus, the dispersion of a contagion, $k$, may be of more use in understanding the spread of Covid-19 than the reproduction number, R0.
The Virus Transmission with Super-spreaders model, written in NetLogo, is an adaptation of the canonical Virus Transmission on a Network model and allows the exploration of various mitigation protocols such as testing and quarantines with both homogenous transmission and heterogenous transmission.
The model consists of a population of individuals arranged in a network, where both population and network degree are tunable. At the start of the simulation, a subset of the population is initially infected. As the model runs, infected individuals will infect neighboring susceptible individuals according to either homogenous or heterogenous transmission, where heterogenous transmission models super-spreaders. In this case, k is described as the percentage of super-spreaders in the population and the differing transmission rates for super-spreaders and non super-spreaders. Infected individuals either recover, at which point they become resistant to infection, or die. Testing regimes cause discovered infected individuals to quarantine for a period of time.
Peer reviewed Agent-based model to simulate equilibria and regime shifts emerged in lake ecosystems
no contributors listed | Published Tuesday, January 25, 2022(An empty output folder named “NETLOGOexperiment” in the same location with the LAKEOBS_MIX.nlogo file is required before the model can be run properly)
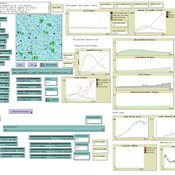
The model is motivated by regime shifts (i.e. abrupt and persistent transition) revealed in the previous paleoecological study of Taibai Lake. The aim of this model is to improve a general understanding of the mechanism of emergent nonlinear shifts in complex systems. Prelimnary calibration and validation is done against survey data in MLYB lakes. Dynamic population changes of function groups can be simulated and observed on the Netlogo interface.
Main functional groups in lake ecosystems were modelled as super-individuals in a space where they interact with each other. They are phytoplankton, zooplankton, submerged macrophyte, planktivorous fish, herbivorous fish and piscivorous fish. The relationships between these functional groups include predation (e.g. zooplankton-phytoplankton), competition (phytoplankton-macrophyte) and protection (macrophyte-zooplankton). Each individual has properties in size, mass, energy, and age as physiological variables and reproduce or die according to predefined criteria. A system dynamic model was integrated to simulate external drivers.
Set biological and environmental parameters using the green sliders first. If the data of simulation are to be logged, set “Logdata” as true and input the name of the file you want the spreadsheet(.csv) to be called. You will need create an empty folder called “NETLOGOexperiment” in the same level and location with the LAKEOBS_MIX.nlogo file. Press “setup” to initialise the system and “go” to start life cycles.
Agent-based simulation of small group decision-making under no communication
Christopher Poile | Published Thursday, May 26, 2016A computational model of a classic small group study by Alex Bavelas. This computational model was designed to explore the difficulty in translating a seemingly simple real-world experiment into a computational model.
AnimDens NetLogo
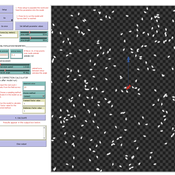
Miguel Pais Christine Ward-Paige | Published Friday, February 10, 2017 | Last modified Sunday, February 23, 2020The model demonstrates how non-instantaneous sampling techniques produce bias by overestimating the number of counted animals, when they move relative to the person counting them.
Shellmound Mobility
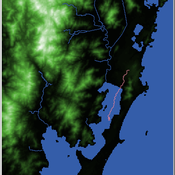
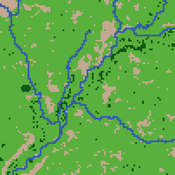
Henrique de Sena Kozlowski | Published Saturday, June 15, 2024Least Cost Path (LCP) analysis is a recurrent theme in spatial archaeology. Based on a cost of movement image, the user can interpret how difficult it is to travel around in a landscape. This kind of analysis frequently uses GIS tools to assess different landscapes. This model incorporates some aspects of the LCP analysis based on GIS with the capabilities of agent-based modeling, such as the possibility to simulate random behavior when moving. In this model the agent will travel around the coastal landscape of Southern Brazil, assessing its path based on the different cost of travel through the patches. The agents represent shellmound builders (sambaquieiros), who will travel mainly through the use of canoes around the lagoons.
How it works?
When the simulation starts the hiker agent moves around the world, a representation of the lagoon landscape of the Santa Catarina state in Southern Brazil. The agent movement is based on the travel cost of each patch. This travel cost is taken from a cost surface raster created in ArcMap to represent the different cost of movement around the landscape. Each tick the agent will have a chance to select the best possible patch to move in its Field of View (FOV) that will take it towards its target destination. If it doesn’t select the best possible patch, it will randomly choose one of the patches to move in its FOV. The simulation stops when the hiker agent reaches the target destination. The elevation raster file and the cost surface map are based on a 1 Arc-second (30m) resolution SRTM image, scaled down 5 times. Each patch represents a square of 150m, with an area of 0,0225km². The dataset uses a UTM Sirgas 2000 22S projection system. There are four different cost functions available to use. They change the cost surface used by the hikers to navigate around the world.
Agent-based model of risk behavior in adolescence
N Schuhmacher P Van Geert L Ballato | Published Monday, June 24, 2013 | Last modified Monday, April 08, 2019The computer model simulates the development of a social network (i.e. formation of friendships and cliques), the (dyadic) interactions between pupils and the development of similarities and differences in their behavioral profiles.
Endogenous Dynamics of Housing Market Cycles
Onur Özgün Birnur Özbaş Yaman Barlas | Published Monday, September 09, 2013 | Last modified Wednesday, January 08, 2014The purpose of this model is to analyze the dynamics of endogenously created oscillations in housing prices using a system dynamics simulation model, built from the perspective of construction companies.
A Complex Model of Voter Turnout
Bruce Edmonds Laurence Lessard-Phillips Ed Fieldhouse | Published Monday, October 13, 2014 | Last modified Tuesday, August 18, 2015This is a complex “Data Integration Model”, following a “KIDS” rather than a “KISS” methodology - guided by the available evidence. It looks at the complex mix of social processes that may determine why people vote or not.
Peer reviewed Strategy with Externalities
J M Applegate Glenn Hoetker | Published Thursday, December 21, 2017The SWE models firms search behaviour as the performance landscape shifts. The shift represents society’s pricing of negative externalities, and the performance landscape is an NK structure. The model is written in NetLogo.
A land-use model to illustrate ambiguity in design
Julia Schindler | Published Monday, October 15, 2012 | Last modified Friday, January 13, 2017This is an agent-based model that allows to test alternative designs for three model components. The model was built using the LUDAS design strategy, while each alternative is in line with the strategy. Using the model, it can be shown that alternative designs, though built on the same strategy, lead to different land-use patterns over time.
Displaying 10 of 64 results for "Melanie Swartz" clear search
