Our mission is to help computational modelers develop, document, and share their computational models in accordance with community standards and good open science and software engineering practices. Model authors can publish their model source code in the Computational Model Library with narrative documentation as well as metadata that supports open science and emerging norms that facilitate software citation, computational reproducibility / frictionless reuse, and interoperability. Model authors can also request private peer review of their computational models. Models that pass peer review receive a DOI once published.
All users of models published in the library must cite model authors when they use and benefit from their code.
Please check out our model publishing tutorial and feel free to contact us if you have any questions or concerns about publishing your model(s) in the Computational Model Library.
Displaying 10 of 450 results for "Therese Lindahl" clear search
Peer reviewed Green Consumption Tipping Point
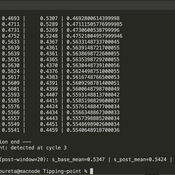
Mario | Published Thursday, February 26, 2026This model is a minimal agent-based model (ABM) of green consumption and market tipping dynamics in a stylised two-firm economy. It is designed as an existence proof to illustrate how weak individual preferences, when combined with habit formation, social influence, and firm price adaptation, can generate non-linear transitions (tipping points) in market outcomes.
The economy consists of:
1) Two firms, each supplying a differentiated consumption bundle that differs in its fixed green share (one relatively greener, one less green).
2) Many households, each consuming a unit mass per period and allocating consumption between the two firms.
…
Toward Market Structure as a Complex System: A Web Based Simulation Assignment Implemented in Netlogo
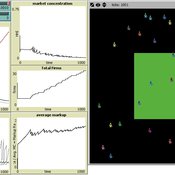
Timothy Kochanski | Published Monday, February 14, 2011 | Last modified Saturday, April 27, 2013This is the model for a paper that is based on a simulation model, programmed in Netlogo, that demonstrates changes in market structure that occur as marginal costs, demand, and barriers to entry change. Students predict and observe market structure changes in terms of number of firms, market concentration, market price and quantity, and average marginal costs, profits, and markups across the market as firms innovate. By adjusting the demand growth and barriers to entry, students can […]
The Targeted Subsidies Plan Model
Hassan Bashiri | Published Thursday, September 21, 2023The targeted subsidies plan model is based on the economic concept of targeted subsidies.
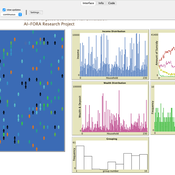
The targeted subsidies plan model simulates the distribution of subsidies among households in a community over several years. The model assumes that the government allocates a fixed amount of money each year for the purpose of distributing cash subsidies to eligible households. The eligible households are identified by dividing families into 10 groups based on their income, property, and wealth. The subsidy is distributed to the first four groups, with the first group receiving the highest subsidy amount. The model simulates the impact of the subsidy distribution process on the income and property of households in the community over time.
The model simulates a community of 230 households, each with a household income and wealth that follows a power-law distribution. The number of household members is modeled by a normal distribution. The model allocates a fixed amount of money each year for the purpose of distributing cash subsidies among eligible households. The eligible households are identified by dividing families into 10 groups based on their income, property, and wealth. The subsidy is distributed to the first four groups, with the first group receiving the highest subsidy amount.
The model runs for a period of 10 years, with the subsidy distribution process occurring every month. The subsidy received by each household is assumed to be spent, and a small portion may be saved and added to the household’s property. At the end of each year, the grouping of households based on income and assets is redone, and a number of families may be moved from one group to another based on changes in their income and property.
…
LogoClim: WorldClim in NetLogo
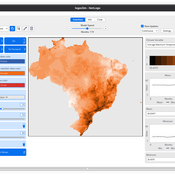
Daniel Vartanian Leandro Garcia Aline Martins de Carvalho Aline | Published Thursday, July 03, 2025 | Last modified Monday, July 13, 2026LogoClim is a NetLogo model designed to be integrated into other simulations through the LevelSpace extension (Hjorth et al., 2020), providing high resolution climate data from sources validated and used by the Intergovernmental Panel on Climate Change (IPCC).
The model simplifies and standardizes the integration of climate data into NetLogo, allowing researchers to focus their efforts on the model itself with the assurance of using reliable and widely recognized data. Although its main use is as a component of larger simulations, LogoClim also has its own graphical interface for monitoring and checking the datasets.
The climate data comes from the WorldClim 2.1 project (Fick & Hijmans, 2017), for which LogoClim works as an interface to NetLogo. The model supports all three WorldClim data series: (1) Historical Climate Data (1970 to 2000), with 12 monthly points for minimum, mean, and maximum temperature, precipitation, solar radiation, wind speed, vapor pressure, elevation, and bioclimatic variables; (2) Historical Monthly Weather Data (1951 to 2024), based on downscaling of CRU-TS-4.09, developed by the Climatic Research Unit at the University of East Anglia (Harris et al., 2020), with minimum and maximum temperature and total precipitation; and (3) Future Climate Data, based on downscaling climate projections derived from global climate models of the Coupled Model Intercomparison Project Phase 6 (CMIP6) (Eyring et al., 2016) for four future periods (2021 to 2040, 2041 to 2060, 2061 to 2080, and 2081 to 2100) and four scenarios based on the Shared Socioeconomic Pathways (SSPs 126, 245, 370, and 585), covering minimum and maximum temperature, total precipitation, and bioclimatic variables. All series are available at multiple spatial resolutions, from 10 minutes (about 340 km² at the equator) to 30 seconds (about 1 km² at the equator).
…
Peer reviewed Dynamic Value-based Cognitive Architectures
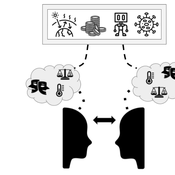
Bart de Bruin | Published Tuesday, November 30, 2021The intention of this model is to create an universal basis on how to model change in value prioritizations within social simulation. This model illustrates the designing of heterogeneous populations within agent-based social simulations by equipping agents with Dynamic Value-based Cognitive Architectures (DVCA-model). The DVCA-model uses the psychological theories on values by Schwartz (2012) and character traits by McCrae and Costa (2008) to create an unique trait- and value prioritization system for each individual. Furthermore, the DVCA-model simulates the impact of both social persuasion and life-events (e.g. information, experience) on the value systems of individuals by introducing the innovative concept of perception thermometers. Perception thermometers, controlled by the character traits, operate as buffers between the internal value prioritizations of agents and their external interactions. By introducing the concept of perception thermometers, the DVCA-model allows to study the dynamics of individual value prioritizations under a variety of internal and external perturbations over extensive time periods. Possible applications are the use of the DVCA-model within artificial sociality, opinion dynamics, social learning modelling, behavior selection algorithms and social-economic modelling.
00b SimEvo_V5.08 NetLogo
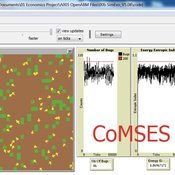
Garvin Boyle | Published Saturday, October 05, 2019In 1985 Dr Michael Palmiter, a high school teacher, first built a very innovative agent-based model called “Simulated Evolution” which he used for teaching the dynamics of evolution. In his model, students can see the visual effects of evolution as it proceeds right in front of their eyes. Using his schema, small linear changes in the agent’s genotype have an exponential effect on the agent’s phenotype. Natural selection therefore happens quickly and effectively. I have used his approach to managing the evolution of competing agents in a variety of models that I have used to study the fundamental dynamics of sustainable economic systems. For example, here is a brief list of some of my models that use “Palmiter Genes”:
- ModEco - Palmiter genes are used to encode negotiation strategies for setting prices;
- PSoup - Palmiter genes are used to control both motion and metabolic evolution;
- TpLab - Palmiter genes are used to study the evolution of belief systems;
- EffLab - Palmiter genes are used to study Jevon’s Paradox, EROI and other things.
…
PopComp
Andre Costopoulos | Published Thursday, December 10, 2020PopComp by Andre Costopoulos 2020
andre.costopoulos@ualberta.ca
Licence: DWYWWI (Do whatever you want with it)
I use Netlogo to build a simple environmental change and population expansion and diffusion model. Patches have a carrying capacity and can host two kinds of populations (APop and BPop). Each time step, the carrying capacity of each patch has a given probability of increasing or decreasing up to a maximum proportion.
…
TechNet_04: Cultural Transmission in a Spatially-Situated Network
Andrew White | Published Monday, October 08, 2012 | Last modified Saturday, April 27, 2013The TechNet_04 is an abstract model that embeds a simple cultural tranmission process in an environment where interaction is structured by spatially-situated networks.
Peer reviewed Personnel decisions in the hierarchy
Smarzhevskiy Ivan | Published Friday, August 19, 2022This is a model of organizational behavior in the hierarchy in which personnel decisions are made.
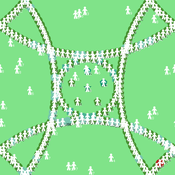
The idea of the model is that the hierarchy, busy with operations, is described by such characteristics as structure (number and interrelation of positions) and material, filling these positions (persons with their individual performance). A particular hierarchy is under certain external pressure (performance level requirement) and is characterized by the internal state of the material (the distribution of the perceptions of others over the ensemble of persons).
The World of the model is a four-level hierarchical structure, consisting of shuff positions of the top manager (zero level of the hierarchy), first-level managers who are subordinate to the top manager, second-level managers (subordinate to the first-level managers) and positions of employees (the third level of the hierarchy). ) subordinated to the second-level managers. Such a hierarchy is a tree, i.e. each position, with the exception of the position of top manager, has a single boss.
Agents in the model are persons occupying the specified positions, the number of persons is set by the slider (HumansQty). Personas have some operational performance (harisma, an unfortunate attribute name left over from the first edition of the model)) and a sense of other personas’ own perceptions. Performance values are distributed over the ensemble of persons according to the normal law with some mean value and variance.
The value of perception by agents of each other is positive or negative (implemented in the model as numerical values equal to +1 and -1). The distribution of perceptions over an ensemble of persons is implemented as a random variable specified by the probability of negative perception, the value of which is set by the control elements of the model interface. The numerical value of the probability equal to 0 corresponds to the case in which all persons positively perceive each other (the numerical value of the random variable is equal to 1, which corresponds to the positive perception of the other person by the individual).
The hierarchy is occupied with operational activity, the degree of intensity of which is set by the external parameter Difficulty. The level of productivity of each manager OAIndex is equal to the level of productivity of the department he leads and is the ratio of the sum of productivity of employees subordinate to the head to the level of complexity of the work Difficulty. An increase in the numerical value of Difficulty leads to a decrease in the OAIndex for all subdivisions of the hierarchy. The managerial meaning of the OAIndex indicator is the percentage of completion of the load specified for the hierarchy as a whole, i.e. the ratio of the actual performance of the structural subdivisions of the hierarchy to the required performance, the level of which is specified by the value of the Difficulty parameter.
…
Peer reviewed BAM: The Bottom-up Adaptive Macroeconomics Model
Alejandro Platas López Alejandro Guerra-Hernández | Published Tuesday, January 14, 2020 | Last modified Sunday, July 26, 2020Overview
Purpose
Modeling an economy with stable macro signals, that works as a benchmark for studying the effects of the agent activities, e.g. extortion, at the service of the elaboration of public policies..
…
Displaying 10 of 450 results for "Therese Lindahl" clear search