Our mission is to help computational modelers develop, document, and share their computational models in accordance with community standards and good open science and software engineering practices. Model authors can publish their model source code in the Computational Model Library with narrative documentation as well as metadata that supports open science and emerging norms that facilitate software citation, computational reproducibility / frictionless reuse, and interoperability. Model authors can also request private peer review of their computational models. Models that pass peer review receive a DOI once published.
All users of models published in the library must cite model authors when they use and benefit from their code.
Please check out our model publishing tutorial and feel free to contact us if you have any questions or concerns about publishing your model(s) in the Computational Model Library.
Displaying 10 of 366 results for "John C Moore" clear search
TechNet_04: Cultural Transmission in a Spatially-Situated Network
Andrew White | Published Monday, October 08, 2012 | Last modified Saturday, April 27, 2013The TechNet_04 is an abstract model that embeds a simple cultural tranmission process in an environment where interaction is structured by spatially-situated networks.
Peer reviewed Avian pest control: Yield outcome due to insectivorous birds, falconry, and integration of nest boxes.
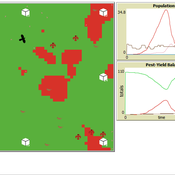
David Jung | Published Monday, November 13, 2023 | Last modified Sunday, November 19, 2023The model aims to simulate predator-prey relationships in an agricultural setting. The focus lies on avian communities and their effect on different pest organisms (here: pest birds, rodents, and arthropod pests). Since most case studies focused on the impact on arthropod pests (AP) alone, this model attempts to include effects on yield outcome. By incorporating three treatments with different factor levels (insectivorous bird species, falconry, nest box density) an experimental setup is given that allows for further statistical analysis to identify an optimal combination of the treatments.
In light of a global decline of birds, insects, and many other groups of organisms, alternative practices of pest management are heavily needed to reduce the input of pesticides. Avian pest control therefore poses an opportunity to bridge the disconnect between humans and nature by realizing ecosystem services and emphasizing sustainable social ecological systems.
Peer reviewed Personnel decisions in the hierarchy
Smarzhevskiy Ivan | Published Friday, August 19, 2022This is a model of organizational behavior in the hierarchy in which personnel decisions are made.
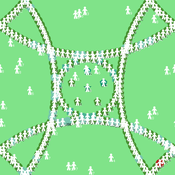
The idea of the model is that the hierarchy, busy with operations, is described by such characteristics as structure (number and interrelation of positions) and material, filling these positions (persons with their individual performance). A particular hierarchy is under certain external pressure (performance level requirement) and is characterized by the internal state of the material (the distribution of the perceptions of others over the ensemble of persons).
The World of the model is a four-level hierarchical structure, consisting of shuff positions of the top manager (zero level of the hierarchy), first-level managers who are subordinate to the top manager, second-level managers (subordinate to the first-level managers) and positions of employees (the third level of the hierarchy). ) subordinated to the second-level managers. Such a hierarchy is a tree, i.e. each position, with the exception of the position of top manager, has a single boss.
Agents in the model are persons occupying the specified positions, the number of persons is set by the slider (HumansQty). Personas have some operational performance (harisma, an unfortunate attribute name left over from the first edition of the model)) and a sense of other personas’ own perceptions. Performance values are distributed over the ensemble of persons according to the normal law with some mean value and variance.
The value of perception by agents of each other is positive or negative (implemented in the model as numerical values equal to +1 and -1). The distribution of perceptions over an ensemble of persons is implemented as a random variable specified by the probability of negative perception, the value of which is set by the control elements of the model interface. The numerical value of the probability equal to 0 corresponds to the case in which all persons positively perceive each other (the numerical value of the random variable is equal to 1, which corresponds to the positive perception of the other person by the individual).
The hierarchy is occupied with operational activity, the degree of intensity of which is set by the external parameter Difficulty. The level of productivity of each manager OAIndex is equal to the level of productivity of the department he leads and is the ratio of the sum of productivity of employees subordinate to the head to the level of complexity of the work Difficulty. An increase in the numerical value of Difficulty leads to a decrease in the OAIndex for all subdivisions of the hierarchy. The managerial meaning of the OAIndex indicator is the percentage of completion of the load specified for the hierarchy as a whole, i.e. the ratio of the actual performance of the structural subdivisions of the hierarchy to the required performance, the level of which is specified by the value of the Difficulty parameter.
…
Peer reviewed The Viability of the Social-Ecological Agroecosystem (ViSA) Spatial Agent-based Model
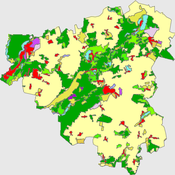
Mostafa Shaaban | Published Friday, June 03, 2022ViSA simulates the decision behaviors of different stakeholders showing demands for ecosystem services (ESS) in agricultural landscape. The lack of sufficient supply of ESSs triggers stakeholders to apply different management options to increase their supply. However, while attempting to reduce the supply-demand gap, conflicts arise among stakeholders due to the tradeoff nature of some ESS. ViSA investigates conditions and scenarios that can minimize such supply-demand gap while reducing the risk of conflicts by suggesting different mixes of management options and decision rules.
LogoClim: WorldClim in NetLogo
Daniel Vartanian Leandro Garcia Aline Martins de Carvalho Aline | Published Thursday, July 03, 2025 | Last modified Monday, July 13, 2026LogoClim is a NetLogo model designed to be integrated into other simulations through the LevelSpace extension (Hjorth et al., 2020), providing high resolution climate data from sources validated and used by the Intergovernmental Panel on Climate Change (IPCC).
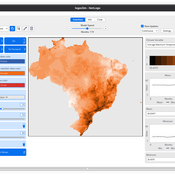
The model simplifies and standardizes the integration of climate data into NetLogo, allowing researchers to focus their efforts on the model itself with the assurance of using reliable and widely recognized data. Although its main use is as a component of larger simulations, LogoClim also has its own graphical interface for monitoring and checking the datasets.
The climate data comes from the WorldClim 2.1 project (Fick & Hijmans, 2017), for which LogoClim works as an interface to NetLogo. The model supports all three WorldClim data series: (1) Historical Climate Data (1970 to 2000), with 12 monthly points for minimum, mean, and maximum temperature, precipitation, solar radiation, wind speed, vapor pressure, elevation, and bioclimatic variables; (2) Historical Monthly Weather Data (1951 to 2024), based on downscaling of CRU-TS-4.09, developed by the Climatic Research Unit at the University of East Anglia (Harris et al., 2020), with minimum and maximum temperature and total precipitation; and (3) Future Climate Data, based on downscaling climate projections derived from global climate models of the Coupled Model Intercomparison Project Phase 6 (CMIP6) (Eyring et al., 2016) for four future periods (2021 to 2040, 2041 to 2060, 2061 to 2080, and 2081 to 2100) and four scenarios based on the Shared Socioeconomic Pathways (SSPs 126, 245, 370, and 585), covering minimum and maximum temperature, total precipitation, and bioclimatic variables. All series are available at multiple spatial resolutions, from 10 minutes (about 340 km² at the equator) to 30 seconds (about 1 km² at the equator).
…
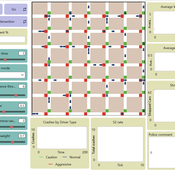
Amber Dilemma Zone: Driver Cognition and Signal Control in Urban Traffic
Mansoor Abdul Bari | Published Sunday, July 19, 2026This model is an extension of Wilensky’s (2003) Traffic Grid, a foundational NetLogo model of urban traffic flow. It embeds a dual-process cognitive architecture into each driver agent, transforming the original’s identical reactive units into cognitively heterogeneous individuals whose internal mental state evolves with experience; making the same intersection produce different decisions from different drivers, and different decisions from the same driver across occasions.
The core question the model addresses is the yellow-light dilemma zone: the seconds following amber onset in which a driver can neither stop safely nor clear the intersection before red. Field research documents that behavioral variance at this moment cannot be explained by geometry or legal obligation alone. This model provides the cognitive architecture that has been missing from traffic ABMs.
Each driver routes every amber-onset decision through either System 1 (fast, heuristic, automatic) or System 2 (slow, deliberative, prospect-theoretic), switching dynamically based on cognitive load, accumulated near-miss memory, and situational framing. The result is crash outcomes that are attributable, path-dependent, and sensitive to both driver disposition and signal infrastructure; none of which fixed-rule models can reproduce. Three signal control modes are included: fixed-cycle (replicating Wilensky’s original), adaptive-queue, and smart occupancy-based switching.
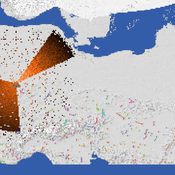
Peer reviewed Social Consequences of Past Compound Events - Laacher See Eruption
Kevin Su Brennen Bouwmeester | Published Monday, May 17, 2021Resilience of humans in the Upper Paleolithic could provide insights in how to defend against today’s environmental threats. Approximately 13,000 years ago, the Laacher See volcano located in present-day western Germany erupted cataclysmically. Archaeological evidence suggests that this is eruption – potentially against the background of a prolonged cold spell – led to considerable culture change, especially at some distance from the eruption (Riede, 2017). Spatially differentiated and ecologically mediated effects on contemporary social networks as well as social transmission effects mediated by demographic changes in the eruption’s wake have been proposed as factors that together may have led to, in particular, the loss of complex technologies such as the bow-and-arrow (Riede, 2014; Riede, 2009).
This model looks at the impact of the interaction between climate change trajectory and an extreme event, such as the Laacher See eruption, on the generational development of hunter-gatherer bands. Historic data is used to model the distribution and population dynamics of hunter-gatherer bands during these circumstances.
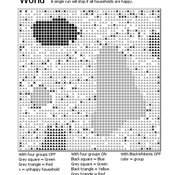
Introducing two extensions of Schelling's segregation model
Andreas Flache Carlos A. de Matos Fernandes | Published Monday, January 25, 2021Schelling famously proposed an extremely simple but highly illustrative social mechanism to understand how strong ethnic segregation could arise in a world where individuals do not necessarily want it. Schelling’s simple computational model is the starting point for our extensions in which we build upon Wilensky’s original NetLogo implementation of this model. Our two NetLogo models can be best studied while reading our chapter “Agent-based Computational Models” (Flache and de Matos Fernandes, 2021). In the chapter, we propose 10 best practices to elucidate how agent-based models are a unique method for providing and analyzing formally precise, and empirically plausible mechanistic explanations of puzzling social phenomena, such as segregation, in the social world. Our chapter addresses in particular analytical sociologists who are new to ABMs.
In the first model (SegregationExtended), we build on Wilensky’s implementation of Schelling’s model which is available in NetLogo library (Wilensky, 1997). We considerably extend this model, allowing in particular to include larger neighborhoods and a population with four groups roughly resembling the ethnic composition of a contemporary large U.S. city. Further features added concern the possibility to include random noise, and the addition of a number of new outcome measures tuned to highlight macro-level implications of the segregation dynamics for different groups in the agent society.
In SegregationDiscreteChoice, we further modify the model incorporating in particular three new features: 1) heterogeneous preferences roughly based on empirical research categorizing agents into low, medium, and highly tolerant within each of the ethnic subgroups of the population, 2) we drop global thresholds (%-similar-wanted) and introduce instead a continuous individual-level single-peaked preference function for agents’ ideal neighborhood composition, and 3) we use a discrete choice model according to which agents probabilistically decide whether to move to a vacant spot or stay in the current spot by comparing the attractiveness of both locations based on the individual preference functions.
…
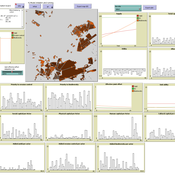
Peer reviewed The Viability of the Social-Ecological Agroecosystem (ViSA) Spatial Agent-based Model
Mostafa Shaaban | Published Monday, March 25, 2024ViSA 2.0.0 is an updated version of ViSA 1.0.0 aiming at integrating empirical data of a new use case that is much smaller than in the first version to include field scale analysis. Further, the code of the model is simplified to make the model easier and faster. Some features from the previous version have been removed.
It simulates decision behaviors of different stakeholders showing demands for ecosystem services (ESS) in agricultural landscape. It investigates conditions and scenarios that can increase the supply of ecosystem services while keeping the viability of the social system by suggesting different mixes of initial unit utilities and decision rules.
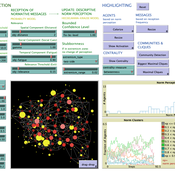
COMM-PDND: Communication-Based Model of Perceived Descriptive Norm Dynamics in Digital Networks
Lars Reinelt | Published Friday, September 08, 2023The Communication-Based Model of Perceived Descriptive Norm Dynamics in Digital Networks (COMM-PDND) is an agent-based model specifically created to examine the dynamics of perceived descriptive norms in the context of digital network structures. The model, developed as part of a master’s thesis titled “The Dynamics of Perceived Descriptive Norms in Digital Network Publics: An Agent-Based Simulation,” emphasizes the critical role of communication processes in norm formation. It focuses on the role of communicative interactions in shaping perceived descriptive norms.
The COMM-PDND is tuned to explore the effects of normative deviance in digital social networks. It provides functionalities for manipulating agents according to their network position, and has a versatile set of customizable parameters, making it adaptable to a wide range of research contexts.
Displaying 10 of 366 results for "John C Moore" clear search