Computational Model Library

Displaying 10 of 921 results for "Rolf Anker Ims" clear search
A simple model is constructed using C# in order to to capture key features of market dynamics, while also producing reasonable results for the individual insurers. A replication of Taylor’s model is also constructed in order to compare results with the new premium setting mechanism. To enable the comparison of the two premium mechanisms, the rest of the model set-up is maintained as in the Taylor model. As in the Taylor example, homogeneous customers represented as a total market exposure which is allocated amongst the insurers.

In each time period, the model undergoes the following steps:
1. Insurers set competitive premiums per exposure unit
2. Losses are generated based on each insurer’s share of the market exposure
3. Accounting results are calculated for each insurer

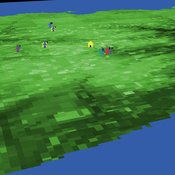
This model simulates a group of farmers that have encounters with individuals of a wildlife population. Each farmer owns a set of cells that represent their farm. Each farmer must decide what cells inside their farm will be used to produce an agricultural good that is self in an external market at a given price. The farmer must decide to protect the farm from potential encounters with individuals of the wildlife population. This decision in the model is called “fencing”. Each time that a cell is fenced, the chances of a wildlife individual to move to that cell is reduced. Each encounter reduces the productive outcome obtained of the affected cell. Farmers, therefore, can reduce the risk of encounters by exclusion. The decision of excluding wildlife is made considering the perception of risk of encounters. In the model, the perception of risk is subjective, as it depends on past encounters and on the perception of risk from other farmers in the community. The community of farmers passes information about this risk perception through a social network. The user (observer) of the model can control the importance of the social network on the individual perception of risk.

Fertility Tradeoffs

Kristin Crouse | Published Tuesday, November 05, 2019 | Last modified Thursday, April 06, 2023

Fertility Tradeoffs is a NetLogo model that illustrates the emergencent tradeoffs between the quality and quantity of offspring. Often, we associate high fitness with maximizing the number of offspring. However, under certain circumstances, it pays instead to optimize the number of offspring, having fewer offspring than is possible. When the number of offspring is reduced, more energy can be invested in each offspring, which can have fitness benefits.

WatASit

Bastien RICHARD Bastien Richard Bruno Bonté Olivier Barreteau Isabelle Braud | Published Friday, December 20, 2019 | Last modified Wednesday, October 28, 2020

WatASit is an agent-based model implemented in the CORMAS plateform. The model is developped to simulate irrigation situations at the operational level during a collective irrigation campaign.

Peer reviewed Personnel decisions in the hierarchy

Smarzhevskiy Ivan | Published Friday, August 19, 2022

This is a model of organizational behavior in the hierarchy in which personnel decisions are made.
The idea of the model is that the hierarchy, busy with operations, is described by such characteristics as structure (number and interrelation of positions) and material, filling these positions (persons with their individual performance). A particular hierarchy is under certain external pressure (performance level requirement) and is characterized by the internal state of the material (the distribution of the perceptions of others over the ensemble of persons).
The World of the model is a four-level hierarchical structure, consisting of shuff positions of the top manager (zero level of the hierarchy), first-level managers who are subordinate to the top manager, second-level managers (subordinate to the first-level managers) and positions of employees (the third level of the hierarchy). ) subordinated to the second-level managers. Such a hierarchy is a tree, i.e. each position, with the exception of the position of top manager, has a single boss.
Agents in the model are persons occupying the specified positions, the number of persons is set by the slider (HumansQty). Personas have some operational performance (harisma, an unfortunate attribute name left over from the first edition of the model)) and a sense of other personas’ own perceptions. Performance values are distributed over the ensemble of persons according to the normal law with some mean value and variance.
The value of perception by agents of each other is positive or negative (implemented in the model as numerical values equal to +1 and -1). The distribution of perceptions over an ensemble of persons is implemented as a random variable specified by the probability of negative perception, the value of which is set by the control elements of the model interface. The numerical value of the probability equal to 0 corresponds to the case in which all persons positively perceive each other (the numerical value of the random variable is equal to 1, which corresponds to the positive perception of the other person by the individual).
The hierarchy is occupied with operational activity, the degree of intensity of which is set by the external parameter Difficulty. The level of productivity of each manager OAIndex is equal to the level of productivity of the department he leads and is the ratio of the sum of productivity of employees subordinate to the head to the level of complexity of the work Difficulty. An increase in the numerical value of Difficulty leads to a decrease in the OAIndex for all subdivisions of the hierarchy. The managerial meaning of the OAIndex indicator is the percentage of completion of the load specified for the hierarchy as a whole, i.e. the ratio of the actual performance of the structural subdivisions of the hierarchy to the required performance, the level of which is specified by the value of the Difficulty parameter.

This is a simulation model of communication between two groups of managers in the course of project implementation. The “world” of the model is a space of interaction between project participants, each of which belongs either to a group of work performers or to a group of customers. Information about the progress of the project is publicly available and represents the deviation Earned value (EV) from the planned project value (cost baseline).
The key elements of the model are 1) persons belonging to a group of customers or performers, 2) agents that are communication acts. The life cycle of persons is equal to the time of the simulation experiment, the life cycle of the communication act is 3 periods of model time (for the convenience of visualizing behavior during the experiment). The communication act occurs at a specific point in the model space, the coordinates of which are realized as random variables. During the experiment, persons randomly move in the model space. The communication act involves persons belonging to a group of customers and a group of performers, remote from the place of the communication act at a distance not exceeding the value of the communication radius (MaxCommRadius), while at least one representative from each of the groups must participate in the communication act. If none are found, the communication act is not carried out. The number of potential communication acts per unit of model time is a parameter of the model (CommPerTick).

The managerial sense of the feedback is the stimulating effect of the positive value of the accumulated communication complexity (positive background of the project implementation) on the productivity of the performers. Provided there is favorable communication (“trust”, “mutual understanding”) between the customer and the contractor, it is more likely that project operations will be performed with less lag behind the plan or ahead of it.
The behavior of agents in the world of the model (change of coordinates, visualization of agents’ belonging to a specific communicative act at a given time, etc.) is not informative. Content data are obtained in the form of time series of accumulated communicative complexity, the deviation of the earned value from the planned value, average indicators characterizing communication - the total number of communicative acts and the average number of their participants, etc. These data are displayed on graphs during the simulation experiment.
The control elements of the model allow seven independent values to be varied, which, even with a minimum number of varied values (three: minimum, maximum, optimum), gives 3^7 = 2187 different variants of initial conditions. In this case, the statistical processing of the results requires repeated calculation of the model indicators for each grid node. Thus, the set of varied parameters and the range of their variation is determined by the logic of a particular study and represents a significant narrowing of the full set of initial conditions for which the model allows simulation experiments.

Co-operative Autonomy

Hani Mohammed Subu Kandaswamy | Published Saturday, April 24, 2021

This model presents an autonomous, two-lane driving environment with a single lane-closure that can be toggled. The four driving scenarios - two baseline cases (based on the real-world) and two experimental setups - are as follows:

  • Baseline-1 is where cars are not informed of the lane closure.
  • Baseline-2 is where a Red Zone is marked wherein cars are informed of the lane closure ahead.
  • Strategy-1 is where cars use a co-operative driving strategy - FAS. <sup>[1]</sup>
  • Strategy-2 is a variant of Strategy-1 and uses comfortable deceleration values instead of the vehicle’s limit.

This model implements a classic scenario used in Reinforcement Learning problem, the “Cliff Walking Problem”. Consider the gridworld shown below (SUTTON; BARTO, 2018). This is a standard undiscounted, episodic task, with start and goal states, and the usual actions causing movement up, down, right, and left. Reward is -1 on all transitions except those into the region marked “The Cliff.” Stepping into this region incurs a reward of -100 and sends the agent instantly back to the start (SUTTON; BARTO, 2018).

CliffWalking

The problem is solved in this model using the Q-Learning algorithm. The algorithm is implemented with the support of the NetLogo Q-Learning Extension

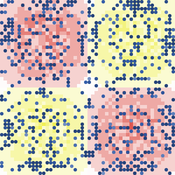
Provided is a landscape of properties where pastoralists make decisions how much livestock they put on their property and how much to suppress fire from occuring. Rangelands can be grass dominated, or unproductive shrubb dominated. Overgrazing and fire suppresion lead to shrub dominated landscapes. What management strategies evolve, and how is this impacted by policies?
The model is discussed in Introduction to Agent-Based Modeling by Marco Janssen. For more information see https://intro2abm.com/.

Our aim is to show effects of group living when only low-level cognition is assumed, such as pattern recognition needed for normal functioning, without assuming individuals have knowledge about others around them or warn them actively.
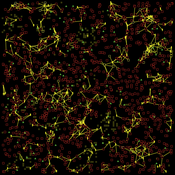
The model is of a group of vigilant foragers staying within a patch, under attack by a predator. The foragers use attentional scanning for predator detection, and flee after detection. This fleeing action constitutes a visual cue to danger, and can be received non-attentionally by others if it occurs within their limited visual field. The focus of this model is on the effectiveness of this non-attentional visual information reception.
A blind angle obstructing cue reception caused by behaviour can exist in front, morphology causes a blind angle in the back. These limitations are represented by two visual field shapes. The scan for predators is all-around, with distance-dependent detection; reception of flight cues is limited by visual field shape.
Initial parameters for instance: group sizes, movement, vision characteristics for predator detection and for cue reception. Captures (failure), number of times the information reached all individuals at the same time (All-fled, success), and several other effects of the visual settings are recorded.

Displaying 10 of 921 results for "Rolf Anker Ims" clear search
This website uses cookies and Google Analytics to help us track user engagement and improve our site. If you'd like to know more information about what data we collect and why, please see our data privacy policy. If you continue to use this site, you consent to our use of cookies.
Accept