About the CoMSES Model Library more info
Our mission is to help computational modelers develop, document, and share their computational models in accordance with community standards and good open science and software engineering practices. Model authors can publish their model source code in the Computational Model Library with narrative documentation as well as metadata that supports open science and emerging norms that facilitate software citation, computational reproducibility / frictionless reuse, and interoperability. Model authors can also request private peer review of their computational models. Models that pass peer review receive a DOI once published.
All users of models published in the library must cite model authors when they use and benefit from their code.
Please check out our model publishing tutorial and feel free to contact us if you have any questions or concerns about publishing your model(s) in the Computational Model Library.
We also maintain a curated database of over 7500 publications of agent-based and individual based models with detailed metadata on availability of code and bibliometric information on the landscape of ABM/IBM publications that we welcome you to explore.
Displaying 10 of 349 results for "Miriam C. Kopels" clear search
Linear Threshold
Kaushik Sarkar | Published Saturday, November 03, 2012 | Last modified Saturday, April 27, 2013NetLogo implementation of Linear Threshold model of influence propagation.
Kulayinjana
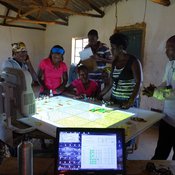
Christophe Le Page Arthur Perrotton Michel De Garine-Wichatitsky Barry Bitu Killion Koyisi Ferdinand Mwamba Cephus Ncube Victor Ncube Siphusisiwe Ndlovu Raphael Ngwenya Ambu Nyathi Fumbane Nyathi Patrick Sibanda Zenzo Sibanda | Published Monday, October 03, 2016a computer-based role-playing game simulating the interactions between farming activities, livestock herding and wildlife in a virtual landscape reproducing local socioecological dynamics at the periphery of Hwange National Park (Zimbabwe).
Peer reviewed HUMLAND FIRE-IN-THE-HOLE agent-based model
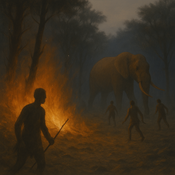
Fulco Scherjon Anastasia Nikulina | Published Monday, October 20, 2025HUMLAND Fire-in-the-Hole is a conceptual agent-based model (ABM) designed to explore the ecological and behavioral consequences of fire-driven hunting strategies employed by hunter-gatherers, specifically Neanderthals, during the Last Interglacial period around the Neumark-Nord (Germany) archaeological site.
This model builds on and specializes the HUMLAND 1.0.0 model (Nikulina et al. 2024), integrating anthropogenic fires, elephant group behavior, and landscape response to simulate interactions between humans, megafauna, and vegetation over time.
Knowledge Sharing in a Hospital
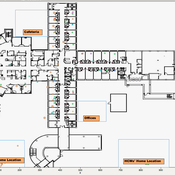
bpint Emily Molfino Joshua Goldstein Kathryn Schaefer Ziemer Mark Orr Bryan Lewis Jose Jimenez | Published Friday, January 27, 2023Organizations are complex systems comprised of many dynamic and evolving interaction patterns among individuals and groups. Understanding these interactions and how patterns, such as informal structures and knowledge sharing behavior, emerge are crucial to creating effective and efficient organizations. To explore such organizational dynamics, the agent-based model integrates a cognitive model, dynamic social networks, and a physical environment.
AncientS-ABM: Agent-Based Modeling of Past Societies Social Organization
Angelos Chliaoutakis | Published Thursday, April 09, 2020AncientS-ABM is an agent-based model for simulating and evaluating the potential social organization of an artificial past society, configured by available archaeological data. Unlike most existing agent-based models used in archaeology, our ABM framework includes completely autonomous, utility-based agents. It also incorporates different social organization paradigms, different decision-making processes, and also different cultivation technologies used in ancient societies. Equipped with such paradigms, the model allows us to explore the transition from a simple to a more complex society by focusing on the historical social dynamics; and to assess the influence of social organization on agents’ population growth, agent community numbers, sizes and distribution.
AncientS-ABM also blends ideas from evolutionary game theory with multi-agent systems’ self-organization. We model the evolution of social behaviours in a population of strategically interacting agents in repeated games where they exchange resources (utility) with others. The results of the games contribute to both the continuous re-organization of the social structure, and the progressive adoption of the most successful agent strategies. Agent population is not fixed, but fluctuates over time, while agents in stage games also receive non-static payoffs, in contrast to most games studied in the literature. To tackle this, we defined a novel formulation of the evolutionary dynamics via assessing agents’ rather than strategies’ fitness.
As a case study, we employ AncientS-ABM to evaluate the impact of the implemented social organization paradigms on an artificial Bronze Age “Minoan” society, located at different geographical parts of the island of Crete, Greece. Model parameter choices are based on archaeological evidence and studies, but are not biased towards any specific assumption. Results over a number of different simulation scenarios demonstrate better sustainability for settlements consisting of and adopting a socio-economic organization model based on self-organization, where a “heterarchical” social structure emerges. Results also demonstrate that successful agent societies adopt an evolutionary approach where cooperation is an emergent strategic behaviour. In simulation scenarios where the natural disaster module was enabled, we observe noticeable changes in the settlements’ distribution, relating to significantly higher migration rates immediately after the modeled Theran eruption. In addition, the initially cooperative behaviour is transformed to a non-cooperative one, thus providing support for archaeological theories suggesting that the volcanic eruption led to a clear breakdown of the Minoan socio-economic system.
…
The Pampas Model: An agent-based model of agricultural systems in the Argentinean Pampas
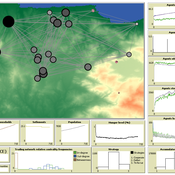
Michael North Federico Bert Guillermo P Podestá Santiago L Rovere Charles Macal | Published Tuesday, July 16, 2013 | Last modified Tuesday, February 17, 2015The Pampas Model is an Agent-Based Model intended to explore the dynamics of structural and land use changes in agricultural systems of the Argentine Pampas in response to climatic, technological economic, and political drivers.
Mobility, Ethnicity, and Language-Based Immigrant Settlement Model - MELBIS
Liliana Perez Jonathan Gaudreau Suzana Dragicevic Taylor Anderson Aaron Leung | Published Monday, June 14, 2021 | Last modified Monday, June 14, 2021MELBIS-V1 is a spatially explicit agent-based model that allows the geospatial simulation of the decision-making process of newcomers arriving in the bilingual cities and boroughs of the island of Montreal, Quebec in CANADA, and the resulting urban segregation spatial patterns. The model was implemented in NetLogo, using geospatial raster datasets of 120m spatial resolution.
MELBIS-V2 enhances MELBIS-V1 to implement and simulate the decision-making processes of incoming immigrants, and to analyze the resulting spatial patterns of segregation as immigrants arrive and settle in various cities in Canada. The arrival and segregation of immigrants is modeled with MELBIS-V2 and compared for three major Canadian immigration gateways, including the City of Toronto, Metro Vancouver, and the City of Calgary.
We construct a new type of agent-based model (ABM) that can simultaneously simulate land-use changes at multiple distant places (namely TeleABM, telecoupled agent-based model). We use soybean trade between Brazil and China as an example, where Brazil is the sending system and China is the receiving system because they are the world’s largest soybean exporter and importer respectively. We select one representative county in each country to calibrate and validate the model with spatio-temporal analysis of historical land-use changes and the empirical analysis of household survey data. The whole model is programmed on RePast Simphony. The most unique features of TeleABM are that it can simulate a telecoupled system and the flows between sending and receiving systems in this telecoupled system.
This model extends the original Artifical Anasazi (AA) model to include individual agents, who vary in age and sex, and are aggregated into households. This allows more realistic simulations of population dynamics within the Long House Valley of Arizona from AD 800 to 1350 than are possible in the original model. The parts of this model that are directly derived from the AA model are based on Janssen’s 1999 Netlogo implementation of the model; the code for all extensions and adaptations in the model described here (the Artificial Long House Valley (ALHV) model) have been written by the authors. The AA model included only ideal and homogeneous “individuals” who do not participate in the population processes (e.g., birth and death)–these processes were assumed to act on entire households only. The ALHV model incorporates actual individual agents and all demographic processes affect these individuals. Individuals are aggregated into households that participate in annual agricultural and demographic cycles. Thus, the ALHV model is a combination of individual processes (birth and death) and household-level processes (e.g., finding suitable agriculture plots).
As is the case for the AA model, the ALHV model makes use of detailed archaeological and paleoenvironmental data from the Long House Valley and the adjacent areas in Arizona. It also uses the same methods as the original model (from Janssen’s Netlogo implementation) to estimate annual maize productivity of various agricultural zones within the valley. These estimates are used to determine suitable locations for households and farms during each year of the simulation.
Artificial Long House Valley-Black Mesa
Lisa Sattenspiel Amy Warren | Published Thursday, March 19, 2020This model is an extension of the Artificial Long House Valley (ALHV) model developed by the authors (Swedlund et al. 2016; Warren and Sattenspiel 2020). The ALHV model simulates the population dynamics of individuals within the Long House Valley of Arizona from AD 800 to 1350. Individuals are aggregated into households that participate in annual agricultural and demographic cycles. The present version of the model incorporates features of the ALHV model including realistic age-specific fertility and mortality and, in addition, it adds the Black Mesa environment and population, as well as additional methods to allow migration between the two regions.
As is the case for previous versions of the ALHV model as well as the Artificial Anasazi (AA) model from which the ALHV model was derived (Axtell et al. 2002; Janssen 2009), this version makes use of detailed archaeological and paleoenvironmental data from the Long House Valley and the adjacent areas in Arizona. It also uses the same methods as the original AA model to estimate annual maize productivity of various agricultural zones within the Long House Valley. A new environment and associated methods have been developed for Black Mesa. Productivity estimates from both regions are used to determine suitable locations for households and farms during each year of the simulation.
Displaying 10 of 349 results for "Miriam C. Kopels" clear search
