About the CoMSES Model Library more info
Our mission is to help computational modelers develop, document, and share their computational models in accordance with community standards and good open science and software engineering practices. Model authors can publish their model source code in the Computational Model Library with narrative documentation as well as metadata that supports open science and emerging norms that facilitate software citation, computational reproducibility / frictionless reuse, and interoperability. Model authors can also request private peer review of their computational models. Models that pass peer review receive a DOI once published.
All users of models published in the library must cite model authors when they use and benefit from their code.
Please check out our model publishing tutorial and feel free to contact us if you have any questions or concerns about publishing your model(s) in the Computational Model Library.
We also maintain a curated database of over 7500 publications of agent-based and individual based models with detailed metadata on availability of code and bibliometric information on the landscape of ABM/IBM publications that we welcome you to explore.
Displaying 10 of 207 results for "Marc Choisy" clear search
Alternative Fuel Design/Consumer Choice Model
Rosanna Garcia | Published Wednesday, September 22, 2010 | Last modified Saturday, April 27, 2013This is a model of the diffusion of alternative fuel vehicles based on manufacturer designs and consumer choices of those designs. It is written in Netlogo 4.0.3. Because it requires data to upload
Individual bias and organizational objectivity
Bo Xu | Published Monday, April 15, 2013 | Last modified Monday, April 08, 2019This model introduces individual bias to the model of exploration and exploitation, simulates knowledge diffusion within organizations, aiming to investigate the effect of individual bias and other related factors on organizational objectivity.
FilterBubbles_in_Carley1991
Benoît Desmarchelier | Published Wednesday, May 21, 2025The model is an extension of: Carley K. (1991) “A theory of group stability”, American Sociological Review, vol. 56, pp. 331-354.
The original model from Carley (1991) works as follows:
- Agents know or ignore a series of knowledge facts;
- At each time step, each agent i choose a partner j to interact with at random, with a probability of choice proportional to the degree of knowledge facts they have in common.
- Agents interact synchronously. As such, interaction happens only if the partnert j is not already busy interacting with someone else.
…
An Agent-Based Model of Space Settlements
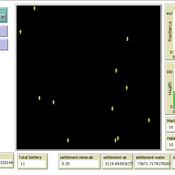
Anamaria Berea | Published Wednesday, August 09, 2023 | Last modified Wednesday, November 01, 2023Background: Establishing a human settlement on Mars is an incredibly complex engineering problem. The inhospitable nature of the Martian environment requires any habitat to be largely self-sustaining. Beyond mining a few basic minerals and water, the colonizers will be dependent on Earth resupply and replenishment of necessities via technological means, i.e., splitting Martian water into oxygen for breathing and hydrogen for fuel. Beyond the technical and engineering challenges, future colonists will also face psychological and human behavior challenges.
Objective: Our goal is to better understand the behavioral and psychological interactions of future Martian colonists through an Agent-Based Modeling (ABM simulation) approach. We seek to identify areas of consideration for planning a colony as well as propose a minimum initial population size required to create a stable colony.
Methods: Accounting for engineering and technological limitations, we draw on research regarding high performing teams in isolated and high stress environments (ex: submarines, Arctic exploration, ISS, war) to include the 4 NASA personality types within the ABM. Interactions between agents with different psychological profiles are modeled at the individual level, while global events such as accidents or delays in Earth resupply affect the colony as a whole.
Results: From our multiple simulations and scenarios (up to 28 Earth years), we found that an initial population of 22 was the minimum required to maintain a viable colony size over the long run. We also found that the Agreeable personality type was the one more likely to survive.
Conclusion We developed a simulation with easy to use GUI to explore various scenarios of human interactions (social, labor, economic, psychological) on a future colony on Mars. We included technological and engineering challenges, but our focus is on the behavioral and psychological effects on the sustainability of the colony on the long run. We find, contrary to other literature, that the minimum number of people with all personality types that can lead to a sustainable settlement is in the tens and not hundreds.
Human mate choice is a complex system
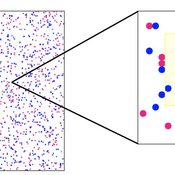
Paul Smaldino Jeffrey C Schank | Published Friday, February 08, 2013 | Last modified Saturday, April 27, 2013A general model of human mate choice in which agents are localized in space, interact with close neighbors, and tend to range either near or far. At the individual level, our model uses two oft-used but incompletely understood decision rules: one based on preferences for similar partners, the other for maximally attractive partners.
An Agent-Based School Choice Matching Model
Connie Wang Weikai Chen Shu-Heng Chen | Published Sunday, February 01, 2015 | Last modified Wednesday, March 06, 2019This model is to simulate and compare the admission effects of 3 school matching mechanisms, serial dictatorship, Boston mechanism, and Chinese Parallel, under different settings of information released.
Demography, Industry and Residential Choice (DIReC) model
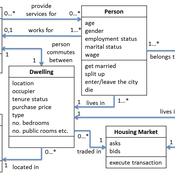
Jiaqi Ge | Published Wednesday, September 04, 2019The integrated and spatially-explicit ABM, called DIReC (Demography, Industry and Residential Choice), has been developed for Aberdeen City and the surrounding Aberdeenshire (Ge, Polhill, Craig, & Liu, 2018). The model includes demographic (individual and household) models, housing infrastructure and occupancy, neighbourhood quality and evolution, employment and labour market, business relocation, industrial structure, income distribution and macroeconomic indicators. DIReC includes a detailed spatial housing model, basing preference models on house attributes and multi-dimensional neighbourhood qualities (education, crime, employment etc.).
The dynamic ABM simulates the interactions between individuals, households, the labour market, businesses and services, neighbourhoods and economic structures. It is empirically grounded using multiple data sources, such as income and gender-age distribution across industries, neighbourhood attributes, business locations, and housing transactions. It has been used to study the impact of economic shocks and structural changes, such as the crash of oil price in 2014 (the Aberdeen economy heavily relies on the gas and oil sector) and the city’s transition from resource-based to a green economy (Ge, Polhill, Craig, & Liu, 2018).
Peer reviewed Ideal Free Distribution of Mobile Pastoralists in the Logone Floodplain, Cameroon
Jeff Cronley Andrew Yoak Mark Moritz Hongyang Pi Ian M Hamilton Paul Maddock | Published Thursday, June 19, 2014 | Last modified Saturday, January 06, 2018The purpose of the model is to examine whether and how mobile pastoralists are able to achieve an Ideal Free Distribution (IFD).
Direct versus Connect
Steven Kimbrough | Published Sunday, January 15, 2023This NetLogo model is an implementation of the mostly verbal (and graphic) model in Jarret Walker’s Human Transit: How Clearer Thinking about Public Transit Can Enrich Our Communities and Our Lives (2011). Walker’s discussion is in the chapter “Connections or Complexity?”. See especially figure 12-2, which is on page 151.
In “Connections or Complexity?”, Walker frames the matter as involving a choice between two conflicting goals. The first goal is to minimize connections, the need to make transfers, in a transit system. People naturally prefer direct routes. The second goal is to minimize complexity. Why? Well, read the chapter, but as a general proposition we want to avoid unnecessary complexity with its attendant operating characteristics (confusing route plans in the case of transit) and management and maintenance challenges. With complexity general comes degraded robustness and resilience.
How do we, how can we, choose between these conflicting goals? The grand suggestion here is that we only choose indirectly, implicitly. In the present example of connections versus complexity we model various alternatives and compare them on measures of performance (MoP) other than complexity or connections per se. The suggestion is that connections and complexity are indicators of, heuristics for, other MoPs that are more fundamental, such as cost, robustness, energy use, etc., and it is these that we at bottom care most about. (Alternatively, and not inconsistently, we can view connections and complexity as two of many MoPs, with the larger issue to be resolve in light of many MoPs, including but not limited to complexity and connections.) We employ modeling to get a handle on these MoPs. Typically, there will be several, taking us thus to a multiple criteria decision making (MCDM) situation. That’s the big picture.
Shellmound Mobility
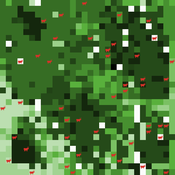
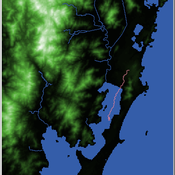
Henrique de Sena Kozlowski | Published Saturday, June 15, 2024Least Cost Path (LCP) analysis is a recurrent theme in spatial archaeology. Based on a cost of movement image, the user can interpret how difficult it is to travel around in a landscape. This kind of analysis frequently uses GIS tools to assess different landscapes. This model incorporates some aspects of the LCP analysis based on GIS with the capabilities of agent-based modeling, such as the possibility to simulate random behavior when moving. In this model the agent will travel around the coastal landscape of Southern Brazil, assessing its path based on the different cost of travel through the patches. The agents represent shellmound builders (sambaquieiros), who will travel mainly through the use of canoes around the lagoons.
How it works?
When the simulation starts the hiker agent moves around the world, a representation of the lagoon landscape of the Santa Catarina state in Southern Brazil. The agent movement is based on the travel cost of each patch. This travel cost is taken from a cost surface raster created in ArcMap to represent the different cost of movement around the landscape. Each tick the agent will have a chance to select the best possible patch to move in its Field of View (FOV) that will take it towards its target destination. If it doesn’t select the best possible patch, it will randomly choose one of the patches to move in its FOV. The simulation stops when the hiker agent reaches the target destination. The elevation raster file and the cost surface map are based on a 1 Arc-second (30m) resolution SRTM image, scaled down 5 times. Each patch represents a square of 150m, with an area of 0,0225km². The dataset uses a UTM Sirgas 2000 22S projection system. There are four different cost functions available to use. They change the cost surface used by the hikers to navigate around the world.
Displaying 10 of 207 results for "Marc Choisy" clear search
