About the CoMSES Model Library more info
Our mission is to help computational modelers develop, document, and share their computational models in accordance with community standards and good open science and software engineering practices. Model authors can publish their model source code in the Computational Model Library with narrative documentation as well as metadata that supports open science and emerging norms that facilitate software citation, computational reproducibility / frictionless reuse, and interoperability. Model authors can also request private peer review of their computational models. Models that pass peer review receive a DOI once published.
All users of models published in the library must cite model authors when they use and benefit from their code.
Please check out our model publishing tutorial and feel free to contact us if you have any questions or concerns about publishing your model(s) in the Computational Model Library.
We also maintain a curated database of over 7500 publications of agent-based and individual based models with detailed metadata on availability of code and bibliometric information on the landscape of ABM/IBM publications that we welcome you to explore.
Displaying 10 of 125 results for "Julio César Acosta–Prado" clear search
Shellmound Mobility
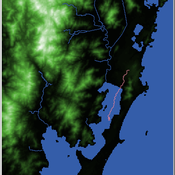
Henrique de Sena Kozlowski | Published Saturday, June 15, 2024Least Cost Path (LCP) analysis is a recurrent theme in spatial archaeology. Based on a cost of movement image, the user can interpret how difficult it is to travel around in a landscape. This kind of analysis frequently uses GIS tools to assess different landscapes. This model incorporates some aspects of the LCP analysis based on GIS with the capabilities of agent-based modeling, such as the possibility to simulate random behavior when moving. In this model the agent will travel around the coastal landscape of Southern Brazil, assessing its path based on the different cost of travel through the patches. The agents represent shellmound builders (sambaquieiros), who will travel mainly through the use of canoes around the lagoons.
How it works?
When the simulation starts the hiker agent moves around the world, a representation of the lagoon landscape of the Santa Catarina state in Southern Brazil. The agent movement is based on the travel cost of each patch. This travel cost is taken from a cost surface raster created in ArcMap to represent the different cost of movement around the landscape. Each tick the agent will have a chance to select the best possible patch to move in its Field of View (FOV) that will take it towards its target destination. If it doesn’t select the best possible patch, it will randomly choose one of the patches to move in its FOV. The simulation stops when the hiker agent reaches the target destination. The elevation raster file and the cost surface map are based on a 1 Arc-second (30m) resolution SRTM image, scaled down 5 times. Each patch represents a square of 150m, with an area of 0,0225km². The dataset uses a UTM Sirgas 2000 22S projection system. There are four different cost functions available to use. They change the cost surface used by the hikers to navigate around the world.
RecovUS: An Agent-Based Model of Post-Disaster Household Recovery
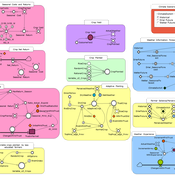
Saeed Moradi | Published Thursday, July 30, 2020The purpose of this model is to explain the post-disaster recovery of households residing in their own single-family homes and to predict households’ recovery decisions from drivers of recovery. Herein, a household’s recovery decision is repair/reconstruction of its damaged house to the pre-disaster condition, waiting without repair/reconstruction, or selling the house (and relocating). Recovery drivers include financial conditions and functionality of the community that is most important to a household. Financial conditions are evaluated by two categories of variables: costs and resources. Costs include repair/reconstruction costs and rent of another property when the primary house is uninhabitable. Resources comprise the money required to cover the costs of repair/reconstruction and to pay the rent (if required). The repair/reconstruction resources include settlement from the National Flood Insurance (NFI), Housing Assistance provided by the Federal Emergency Management Agency (FEMA-HA), disaster loan offered by the Small Business Administration (SBA loan), a share of household liquid assets, and Community Development Block Grant Disaster Recovery (CDBG-DR) fund provided by the Department of Housing and Urban Development (HUD). Further, household income determines the amount of rent that it can afford. Community conditions are assessed for each household based on the restoration of specific anchors. ASNA indexes (Nejat, Moradi, & Ghosh 2019) are used to identify the category of community anchors that is important to a recovery decision of each household. Accordingly, households are indexed into three classes for each of which recovery of infrastructure, neighbors, or community assets matters most. Further, among similar anchors, those anchors are important to a household that are located in its perceived neighborhood area (Moradi, Nejat, Hu, & Ghosh 2020).
Opportunity cost of walking away in the spatial iterated prisoner's dilemma
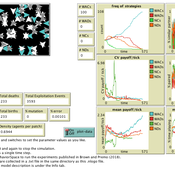
Luke Premo | Published Wednesday, April 03, 2019Previous work with the spatial iterated prisoner’s dilemma has shown that “walk away” cooperators are able to outcompete defectors as well as cooperators that do not respond to defection, but it remains to be seen just how robust the so-called walk away strategy is to ecologically important variables such as population density, error, and offspring dispersal. Our simulation experiments identify socio-ecological conditions in which natural selection favors strategies that emphasize forgiveness over flight in the spatial iterated prisoner’s dilemma. Our interesting results are best explained by considering how population density, error, and offspring dispersal affect the opportunity cost associated with walking away from an error-prone partner.
Automatic multi game chess
Julia Kasmire | Published Monday, July 22, 2019This model converts cleaned up versions of .pgn files (records of real chess games) and conversts them into files that record all of the events and “possible” events within a game of chess. This is intended to be a way to create sets of data that capture event sequences within the relatively complex but finite context of chess games as a proxy or “toy” data set. Although not a perfect correlation, these toy data sets are a first step in analysing complex and dynamic systems of events and possible events that happen in the real world.
Telephone Game
Julia Kasmire | Published Friday, January 10, 2020This is a model of a game of Telephone (also known as Chinese Whishpers in the UK), with agents representing people that can be asked, to play. The first player selects a word from their internal vocabulary and “whispers” it to the next player, who may mishear it depending on the current noise level, who whispers that word to the next player, and so on.
When the game ends, the word chosen by the first player is compared to the word heard by the last player. If they match exactly, all players earn large prize. If the words do not match exactly, a small prize is awarded to all players for each part of the words that do match. Players change color to reflect their current prize-count. A histogram shows the distribution of colors over all the players.
The user can decide on factors like
* how many players there are,
…
Tram Commute
Julia Kasmire | Published Thursday, February 13, 2020 | Last modified Monday, March 02, 2020A demonstration model showing how modellers can create a multi regional tram network with commuters, destinations and houses. The model offers options to create a random tram network made from modeller input or to load shapefiles for the Greater Manchester Metrolink.
The model uses NetLogo with gis, nw an csv extensions.
Agent-based tax evasion model for investigating impacts of public disclosure
Hiroyuki Sano | Published Thursday, March 14, 2024The model explores the impact of public disclosure on tax compliance among diverse agents, including individual taxpayers and a tax authority. It incorporates heterogeneous preferences and income endowments among taxpayers, captured through a utility function that considers psychic costs subtracted from expected pecuniary utility. These costs include moral, reciprocity, and stigma costs associated with norm violations, leading to variations in taxpayers’ risk attitudes and related parameters. The tax authority’s attributes, such as the frequency of random audits, penalty rate, and the choice between partial or full disclosure, remain fixed throughout the simulation. Income endowments and preference parameters are randomly assigned to taxpayers at the outset.
Taxpayers maximize their expected utility by reporting income, taking into account tax, penalty, and audit rates. They make annual decisions based on their own and their peers’ behaviors from the previous year. Taxpayers indirectly interact at the societal level through public disclosure conducted by the tax authority, exchanging tax information among peers. Each period in the simulation collects data on total reported income, average compliance rates per income group, distribution of compliance rates, counts of compliers, full evaders, partial evaders, and the numbers of taxpayers experiencing guilt and anger. The model evaluates whether public disclosure positively or negatively impacts compliance rates and quantifies this impact based on aggregated individual reporting behaviors.
Reflexivity in a diffusion of innovations model
César García-Díaz Carlos Cordoba | Published Thursday, May 07, 2020In this agent-based model, agents decide to adopt a new product according to a utility function that depends on two kinds of social influences. First, there is a local influence exerted on an agent by her closest neighbors that have already adopted, and also by herself if she feels the product suits her personal needs. Second, there is a global influence which leads agents to adopt when they become aware of emerging trends happening in the system. For this, we endow agents with a reflexive capacity that allows them to recognize a trend, even if they can not perceive a significant change in their neighborhood.
Results reveal the appearance of slowdown periods along the adoption rate curve, in contrast with the classic stylized bell-shaped behavior. Results also show that network structure plays an important role in the effect of reflexivity: while some structures (e.g., scale-free networks) may amplify it, others (e.g., small-world structure) weaken such an effect.
Agent-Based Model for the Evolution of Ethnocentrism
Max Hartshorn | Published Saturday, March 24, 2012 | Last modified Saturday, April 27, 2013This is an implementation of an agent based model for the evolution of ethnocentrism. While based off a model published by Hammond and Axelrod (2006), the code has been modified to allow for a more fine-grained analysis of evolutionary dynamics.
Impact of Seasonal Forecast Use on Agricultural Income in a System with Varying Crop Costs and Returns
Thushara Gunda Josh T Bazuin John Nay Kam L Yeung | Published Tuesday, February 07, 2017The objective of the model is to evaluate the impact of seasonal forecasts on a farmer’s net agricultural income when their crop choices have different and variable costs and returns.
Displaying 10 of 125 results for "Julio César Acosta–Prado" clear search


