About the CoMSES Model Library more info
Our mission is to help computational modelers develop, document, and share their computational models in accordance with community standards and good open science and software engineering practices. Model authors can publish their model source code in the Computational Model Library with narrative documentation as well as metadata that supports open science and emerging norms that facilitate software citation, computational reproducibility / frictionless reuse, and interoperability. Model authors can also request private peer review of their computational models. Models that pass peer review receive a DOI once published.
All users of models published in the library must cite model authors when they use and benefit from their code.
Please check out our model publishing tutorial and feel free to contact us if you have any questions or concerns about publishing your model(s) in the Computational Model Library.
We also maintain a curated database of over 7500 publications of agent-based and individual based models with detailed metadata on availability of code and bibliometric information on the landscape of ABM/IBM publications that we welcome you to explore.
Displaying 10 of 926 results for "Am Vaes - Van De Hulsbeek" clear search
A Model of the Gender Cliff in the Relative Contribution to the Household Income
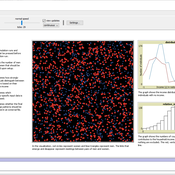
André Grow Jan Van Bavel | Published Wednesday, December 18, 2019In Western countries, the distribution of relative incomes within marriages tends to be skewed in a remarkable way. Husbands usually do not only earn more than their female partners, but there also is a striking discontinuity in their relative contributions to the household income at the 50/50 point: many wives contribute just a bit less than or as much as their husbands, but few contribute more. Our model makes it possible to study a social mechanism that might create this ‘cliff’: women and men differ in their incomes (even outside marriage) and this may differentially affect their abilities to find similar- or higher-income partners. This may ultimately contribute to inequalities within the households that form. The model and associated files make it possible to assess the merit of this mechanism in 27 European countries.
Cellular automata model of social networks
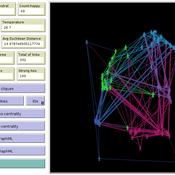
Rubens de Almeida Zimbres | Published Tuesday, August 02, 2022This project was developed during the Santa Fe course Introduction to Agent-Based Modeling 2022. The origin is a Cellular Automata (CA) model to simulate human interactions that happen in the real world, from Rubens and Oliveira (2009). These authors used a market research with real people in two different times: one at time zero and the second at time zero plus 4 months (longitudinal market research). They developed an agent-based model whose initial condition was inherited from the results of the first market research response values and evolve it to simulate human interactions with Agent-Based Modeling that led to the values of the second market research, without explicitly imposing rules. Then, compared results of the model with the second market research. The model reached 73.80% accuracy.
In the same way, this project is an Exploratory ABM project that models individuals in a closed society whose behavior depends upon the result of interaction with two neighbors within a radius of interaction, one on the relative “right” and other one on the relative “left”. According to the states (colors) of neighbors, a given cellular automata rule is applied, according to the value set in Chooser. Five states were used here and are defined as levels of quality perception, where red (states 0 and 1) means unhappy, state 3 is neutral and green (states 3 and 4) means happy.
There is also a message passing algorithm in the social network, to analyze the flow and spread of information among nodes. Both the cellular automaton and the message passing algorithms were developed using the Python extension. The model also uses extensions csv and arduino.
Shellmound Mobility
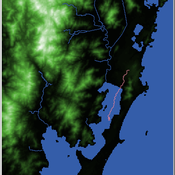
Henrique de Sena Kozlowski | Published Saturday, June 15, 2024Least Cost Path (LCP) analysis is a recurrent theme in spatial archaeology. Based on a cost of movement image, the user can interpret how difficult it is to travel around in a landscape. This kind of analysis frequently uses GIS tools to assess different landscapes. This model incorporates some aspects of the LCP analysis based on GIS with the capabilities of agent-based modeling, such as the possibility to simulate random behavior when moving. In this model the agent will travel around the coastal landscape of Southern Brazil, assessing its path based on the different cost of travel through the patches. The agents represent shellmound builders (sambaquieiros), who will travel mainly through the use of canoes around the lagoons.
How it works?
When the simulation starts the hiker agent moves around the world, a representation of the lagoon landscape of the Santa Catarina state in Southern Brazil. The agent movement is based on the travel cost of each patch. This travel cost is taken from a cost surface raster created in ArcMap to represent the different cost of movement around the landscape. Each tick the agent will have a chance to select the best possible patch to move in its Field of View (FOV) that will take it towards its target destination. If it doesn’t select the best possible patch, it will randomly choose one of the patches to move in its FOV. The simulation stops when the hiker agent reaches the target destination. The elevation raster file and the cost surface map are based on a 1 Arc-second (30m) resolution SRTM image, scaled down 5 times. Each patch represents a square of 150m, with an area of 0,0225km². The dataset uses a UTM Sirgas 2000 22S projection system. There are four different cost functions available to use. They change the cost surface used by the hikers to navigate around the world.
Shellmound Trade
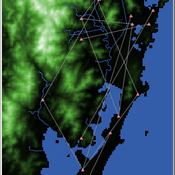
Henrique de Sena Kozlowski | Published Saturday, June 15, 2024This model simulates different trade dynamics in shellmound (sambaqui) builder communities in coastal Southern Brazil. It features two simulation scenarios, one in which every site is the same and another one testing different rates of cooperation. The purpose of the model is to analyze the networks created by the trade dynamics and explore the different ways in which sambaqui communities were articulated in the past.
How it Works?
There are a few rules operating in this model. In either mode of simulation, each tick the agents will produce an amount of resources based on the suitability of the patches inside their occupation-radius, after that the procedures depend on the trade dynamic selected. For BRN? the agents will then repay their owed resources, update their reputation value and then trade again if they need to. For GRN? the agents will just trade with a connected agent if they need to. After that the agents will then consume a random amount of resources that they own and based on that they will grow (split) into a new site or be removed from the simulation. The simulation runs for 1000 ticks. Each patch correspond to a 300x300m square of land in the southern coast of Santa Catarina State in Brazil. Each agent represents a shellmound (sambaqui) builder community. The data for the world were made from a SRTM raster image (1 arc-second) in ArcMap. The sites can be exported into a shapefile (.shp) vector to display in ArcMap. It uses a UTM Sirgas 2000 22S projection system.
Two agent-based models of cooperation in dynamic groups and fixed social networks
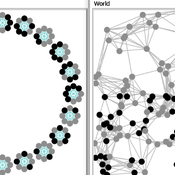
Carlos A. de Matos Fernandes | Published Thursday, January 20, 2022Both models simulate n-person prisoner dilemma in groups (left figure) where agents decide to C/D – using a stochastic threshold algorithm with reinforcement learning components. We model fixed (single group ABM) and dynamic groups (bad-barrels ABM). The purpose of the bad-barrels model is to assess the impact of information during meritocratic matching. In the bad-barrels model, we incorporated a multidimensional structure in which agents are also embedded in a social network (2-person PD). We modeled a random and homophilous network via a random spatial graph algorithm (right figure).
A model to explore the link between the gender-gap reversal in education and relative divorce risks
Jan Van Bavel Christine Schnor André Grow | Published Thursday, June 30, 2016 | Last modified Wednesday, September 13, 2017This model explores a social mechanism that links the reversal of the gender gap in education with changing patterns in relative divorce risks in 12 European countries.
Opinion Leaders' Role in Innovation Diffusion
Peter Van Eck | Published Wednesday, March 10, 2010 | Last modified Saturday, April 27, 2013This model is used to investigate the role of opinion leader. More specifically: the influence of ‘innovative behavior’, ‘weigth of normative influence’, ‘better product judgment’, ‘number of opinion
CONSERVAT
Pieter Van Oel | Published Monday, April 13, 2015The CONSERVAT model evaluates the effect of social influence among farmers in the Lake Naivasha basin (Kenya) on the spatiotemporal diffusion pattern of soil conservation effort levels and the resulting reduction in lake sedimentation.
MCR Model
Davide Secchi Nuno R Barros De Oliveira | Published Friday, July 22, 2016 | Last modified Saturday, January 23, 2021The aim of the model is to define when researcher’s assumptions of dependence or independence of cases in multiple case study research affect the results — hence, the understanding of these cases.
Peer reviewed Ants Digging Networks
Elske van der Vaart | Published Friday, September 14, 2018This is a NetLogo version of Buhl et al.’s (2005) model of self-organised digging activity in ant colonies. It was built for a master’s course on self-organisation and its intended use is still educational. The ants’ behavior can easily be changed by toggling switches on the interface, or, for more advanced students, there is R code included allowing the model to be run and analysed through RNetLogo.
Displaying 10 of 926 results for "Am Vaes - Van De Hulsbeek" clear search
