About the CoMSES Model Library more info
Our mission is to help computational modelers develop, document, and share their computational models in accordance with community standards and good open science and software engineering practices. Model authors can publish their model source code in the Computational Model Library with narrative documentation as well as metadata that supports open science and emerging norms that facilitate software citation, computational reproducibility / frictionless reuse, and interoperability. Model authors can also request private peer review of their computational models. Models that pass peer review receive a DOI once published.
All users of models published in the library must cite model authors when they use and benefit from their code.
Please check out our model publishing tutorial and feel free to contact us if you have any questions or concerns about publishing your model(s) in the Computational Model Library.
We also maintain a curated database of over 7500 publications of agent-based and individual based models with detailed metadata on availability of code and bibliometric information on the landscape of ABM/IBM publications that we welcome you to explore.
Displaying 10 of 1109 results for "A Flache" clear search
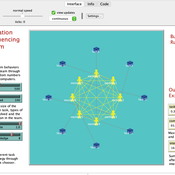
Peer reviewed A Computational Simulation for Task Allocation Influencing Performance in the Team System
Shaoni Wang | Published Friday, November 11, 2022 | Last modified Thursday, April 06, 2023This model system aims to simulate the whole process of task allocation, task execution and evaluation in the team system through a feasible method. On the basis of Complex Adaptive Systems (CAS) theory and Agent-based Modelling (ABM) technologies and tools, this simulation system attempts to abstract real-world teams into MAS models. The author designs various task allocation strategies according to different perspectives, and the interaction among members is concerned during the task-performing process. Additionally, knowledge can be acquired by such an interaction process if members encounter tasks they cannot handle directly. An artificial computational team is constructed through ABM in this simulation system, to replace real teams and carry out computational experiments. In all, this model system has great potential for studying team dynamics, and model explorers are encouraged to expand on this to develop richer models for research.
An agent-based model of cultural change for a low-carbon transition
Daniel Torren-Peraire | Published Friday, November 10, 2023An ABM of changes in individuals’ lifestyles which considers their
evolving behavioural choices. Individuals have a set of environmental behavioural traits that spread through a fixed Watts–Strogatz graph via social interactions with their neighbours. These exchanges are mediated by transmission biases informing from whom an individual learns and
how much attention is paid. The influence of individuals on each other is a function of their similarity in environmental identity, where we represent environmental identity computationally by aggregating past agent attitudes towards multiple environmentally related behaviours. To perform a behaviour, agents must both have
a sufficiently positive attitude toward a behaviour and overcome a corresponding threshold. This threshold
structure, where the desire to perform a behaviour does not equal its enactment, allows for a lack of coherence
between attitudes and actual emissions. This leads to a disconnect between what people believe and what
…
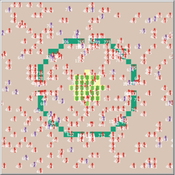
Design principles for a redistributive collective action institution in times of crisis
Aashis Joshi | Published Friday, September 15, 2023What policy measures are effective in redistributing essential resources during crisis situations such as climate change impacts? We model a collective action institution with different rules for designing and organizing it, and make our analysis specific to various societal contexts.
Our model captures a generic societal context of unequal vulnerability and climate change impact in a stylized form. We represent a community of people who harvest and consume an essential resource to maintain their well-being. However, their ability to harvest the resource is not equal; people are characterized by a ‘resource access’ attribute whose values are uniformly distributed from 0 to 1 in the population. A person’s resource access value determines the amount of resource units they are able to harvest, and therefore the welfare levels they are able to attain. People travel to the centralized resource region and derive well-being or welfare, represented as an energy gain, by harvesting and consuming resource units.
The community is subject to a climate change impact event that occurs with a certain periodicity and over a certain duration. The capacity of resource units to regenerate diminishes during the impact events. Unequal capacities to access the essential resource results in unequal vulnerability among people with regards to their ability to maintain a sufficient welfare level, especially during impact events.
…
Hyperconnectivity, and Fact-Checking- Modeling Witnessing as a Traditional Coast Salish Mechanism
Adam Rorabaugh | Published Thursday, May 01, 2025An unintended consequence of low cost maritime travel may be hyperconnectedness, creating social situations where information can be readily passed before it is verified- an issue not limited to modern digitally connected societies. In traditional Coast Salish societies, the peoples of what is now Western Washington and Southwestern British Columbia, oral traditions were vertified through a process called witnessing. Witnesses would be trained to recount and verify oral history and traditional teachings at high fidelity. Here, a simple model based on dual inheritance approaches to genes and culture, is used to compare this specific form of verifying socially important information compared to modern mass communication. The model suggests that witnessing is a high fidelity form of transmitting knowledge with a low error rate, more in line with modern apprenticeships than mass communication. Social mechanisms such as witnessing provide solutions to issues faced in contemporary discourse where the validity of information and even fact checking mechanisms may be biased or counterfactual. This effort also demonstrates the utillity of using modeling approaches to highlight how specific, historically contingent institutions such as witnesses can be drawn upon to model potential solutions to contemporary issues solved in the past in traditional Coast Salish practice.
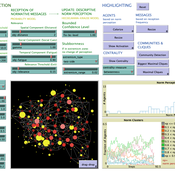
COMM-PDND: Communication-Based Model of Perceived Descriptive Norm Dynamics in Digital Networks
Lars Reinelt | Published Friday, September 08, 2023The Communication-Based Model of Perceived Descriptive Norm Dynamics in Digital Networks (COMM-PDND) is an agent-based model specifically created to examine the dynamics of perceived descriptive norms in the context of digital network structures. The model, developed as part of a master’s thesis titled “The Dynamics of Perceived Descriptive Norms in Digital Network Publics: An Agent-Based Simulation,” emphasizes the critical role of communication processes in norm formation. It focuses on the role of communicative interactions in shaping perceived descriptive norms.
The COMM-PDND is tuned to explore the effects of normative deviance in digital social networks. It provides functionalities for manipulating agents according to their network position, and has a versatile set of customizable parameters, making it adaptable to a wide range of research contexts.
Space colonization
allagonne | Published Wednesday, January 05, 2022Agent-Based-Modeling - space colonization
ask me for the .nlogo model
WHAT IS IT?
The goal of this project is to simulate with NetLogo (v6.2) a space colonization of humans, starting from Earth, into the Milky Way.
HOW IT WORKS
…
NarrABS
Tilman Schenk | Published Thursday, September 20, 2012 | Last modified Saturday, April 27, 2013An agent based simulation of a political process based on stakeholder narratives
An empirical ABM for regional land use/cover change: a Dutch case study
Diego Valbuena | Published Saturday, March 12, 2011 | Last modified Thursday, November 11, 2021This is an empirical model described in http://dx.doi.org/10.1016/j.landurbplan.2010.05.001. The objective of the model is to simulate how the decision-making of farmers/agents with different strategies can affect the landscape structure in a region in the Netherlands.
A simulation tool for capability-based team task allocation in emergency-responce environments
Afsaneh Fatemi | Published Wednesday, March 16, 2011 | Last modified Saturday, April 27, 2013Its a multi agent simulation environment, provided using JADE/Java. It gets the number of agents and tasks, then divides the physical environment to some segments, and then runs a greedy capability-based coalition formation and task allocation algorithm to assign tasks to groups of agents and complete the tasks.
A simple Multi-Agent System of the Tragedy Of the Commons (MASTOC-s)
Julia Schindler | Published Friday, June 29, 2012 | Last modified Saturday, April 27, 2013This is a simple model replicating Hardin’s Tragedy of the Commons using reactive agents that have psychological behavioral and social preferences.
Displaying 10 of 1109 results for "A Flache" clear search


