Our mission is to help computational modelers develop, document, and share their computational models in accordance with community standards and good open science and software engineering practices. Model authors can publish their model source code in the Computational Model Library with narrative documentation as well as metadata that supports open science and emerging norms that facilitate software citation, computational reproducibility / frictionless reuse, and interoperability. Model authors can also request private peer review of their computational models. Models that pass peer review receive a DOI once published.
All users of models published in the library must cite model authors when they use and benefit from their code.
Please check out our model publishing tutorial and feel free to contact us if you have any questions or concerns about publishing your model(s) in the Computational Model Library.
Displaying 10 of 57 results for "Muhammad Abdullah Yasser" clear search
An agent-based artificial stock with a dynamic investor network
Matthew Oldham | Published Tuesday, June 25, 2019The model is an agent-based artificial stock market where investors connect in a dynamic network. The network is dynamic in the sense that the investors, at specified intervals, decide whether to keep their current adviser (those investors they receive trading advise from). The investors also gain information from a private source and share public information about the risky asset. Investors have different tendencies to follow the different information sources, consider differing amounts of history, and have different thresholds for investing.
Mobility, Ethnicity, and Language-Based Immigrant Settlement Model - MELBIS
Liliana Perez Jonathan Gaudreau Suzana Dragicevic Taylor Anderson Aaron Leung | Published Monday, June 14, 2021 | Last modified Monday, June 14, 2021MELBIS-V1 is a spatially explicit agent-based model that allows the geospatial simulation of the decision-making process of newcomers arriving in the bilingual cities and boroughs of the island of Montreal, Quebec in CANADA, and the resulting urban segregation spatial patterns. The model was implemented in NetLogo, using geospatial raster datasets of 120m spatial resolution.
MELBIS-V2 enhances MELBIS-V1 to implement and simulate the decision-making processes of incoming immigrants, and to analyze the resulting spatial patterns of segregation as immigrants arrive and settle in various cities in Canada. The arrival and segregation of immigrants is modeled with MELBIS-V2 and compared for three major Canadian immigration gateways, including the City of Toronto, Metro Vancouver, and the City of Calgary.
Shellmound Mobility
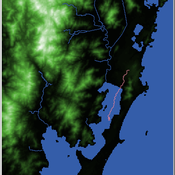
Henrique de Sena Kozlowski | Published Saturday, June 15, 2024Least Cost Path (LCP) analysis is a recurrent theme in spatial archaeology. Based on a cost of movement image, the user can interpret how difficult it is to travel around in a landscape. This kind of analysis frequently uses GIS tools to assess different landscapes. This model incorporates some aspects of the LCP analysis based on GIS with the capabilities of agent-based modeling, such as the possibility to simulate random behavior when moving. In this model the agent will travel around the coastal landscape of Southern Brazil, assessing its path based on the different cost of travel through the patches. The agents represent shellmound builders (sambaquieiros), who will travel mainly through the use of canoes around the lagoons.
How it works?
When the simulation starts the hiker agent moves around the world, a representation of the lagoon landscape of the Santa Catarina state in Southern Brazil. The agent movement is based on the travel cost of each patch. This travel cost is taken from a cost surface raster created in ArcMap to represent the different cost of movement around the landscape. Each tick the agent will have a chance to select the best possible patch to move in its Field of View (FOV) that will take it towards its target destination. If it doesn’t select the best possible patch, it will randomly choose one of the patches to move in its FOV. The simulation stops when the hiker agent reaches the target destination. The elevation raster file and the cost surface map are based on a 1 Arc-second (30m) resolution SRTM image, scaled down 5 times. Each patch represents a square of 150m, with an area of 0,0225km². The dataset uses a UTM Sirgas 2000 22S projection system. There are four different cost functions available to use. They change the cost surface used by the hikers to navigate around the world.
Soy2Grow-ABM-V1
Siavash Farahbakhsh | Published Monday, January 20, 2025The Soy2Grow ABM aims to simulate the adoption of soybean production in Flanders, Belgium. The model primarily considers two types of agents as farmers: 1) arable and 2) dairy farmers. Each farmer, based on its type, assesses the feasibility of adopting soybean cultivation. The feasibility assessment depends on many interrelated factors, including price, production costs, yield, disease, drought (i.e., environmental stress), social pressure, group formations, learning and skills, risk-taking, subsidies, target profit margins, tolerance to bad experiences, etc. Moreover, after adopting soybean production, agents will reassess their performance. If their performance is unsatisfactory, an agent may opt out of soy production. Therefore, one of the main outcomes to look for in the model is the number of adopters over time.
The main agents are farmers. Generally, factors influencing farmers’ decision-making are divided into seven main areas: 1) external environmental factors, 2) cooperation and learning (with slight differences depending on whether they are arable or dairy farmers), 3) crop-specific factors, 4) economics, 5) support frameworks, 6) behavioral factors, and 7) the role of mobile toasters (applicable only to dairy farmers).
Moreover, factors not only influence decision-making but also interact with each other. Specifically, external environmental factors (i.e., stress) will result in lower yield and quality (protein content). The reducing effect, identified during participatory workshops, can reach 50 %. Skills can grow and improve yield; however, their growth has a limit and follows different learning curves depending on how individualistic a farmer is. During participatory workshops, it was identified that, contrary to cooperative farmers, individualistic farmers may learn faster and reach their limits more quickly. Furthermore, subsidies directly affect revenues and profit margins; however, their impact may disappear when they are removed. In the case of dairy farmers, mobile toasters play an important role, adding toasting and processing costs to those producing soy for their animal feed consumption.
Last but not least, behavioral factors directly influence the final adoption decision. For example, high risk-taking farmers may adopt faster, whereas more conservative farmers may wait for their neighbors to adopt first. Farmers may evaluate their success based on their own targets and may also consider other crops rather than soy.
A model to explore the link between the gender-gap reversal in education and relative divorce risks
Jan Van Bavel Christine Schnor André Grow | Published Thursday, June 30, 2016 | Last modified Wednesday, September 13, 2017This model explores a social mechanism that links the reversal of the gender gap in education with changing patterns in relative divorce risks in 12 European countries.
Peer reviewed An extended replication of Abelson's and Bernstein's community referendum simulation
Klaus G. Troitzsch | Published Friday, October 25, 2019 | Last modified Friday, August 25, 2023This is an extended replication of Abelson’s and Bernstein’s early computer simulation model of community referendum controversies which was originally published in 1963 and often cited, but seldom analysed in detail. This replication is in NetLogo 6.3.0, accompanied with an ODD+D protocol and class and sequence diagrams.
This replication replaces the original scales for attitude position and interest in the referendum issue which were distributed between 0 and 1 with values that are initialised according to a normal distribution with mean 0 and variance 1 to make simulation results easier compatible with scales derived from empirical data collected in surveys such as the European Value Study which often are derived via factor analysis or principal component analysis from the answers to sets of questions.
Another difference is that this model is not only run for Abelson’s and Bernstein’s ten week referendum campaign but for an arbitrary time in order that one can find out whether the distributions of attitude position and interest in the (still one-dimensional) issue stabilise in the long run.
Digital Mobility Model (DMM)
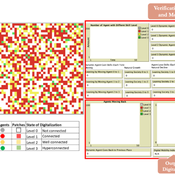
Na (Richard) Jiang Fiammetta Brandajs | Published Thursday, February 01, 2024 | Last modified Friday, February 02, 2024The purpose of the Digital Mobility Model (DMM) is to explore how a society’s adoption of digital technologies can impact people’s mobilities and immobilities within an urban environment. Thus, the model contains dynamic agents with different levels of digital technology skills, which can affect their ability to access urban services using digital systems (e.g., healthcare or municipal public administration with online appointment systems). In addition, the dynamic agents move within the model and interact with static agents (i.e., places) that represent locations with different levels of digitalization, such as restaurants with online reservation systems that can be considered as a place with a high level of digitalization. This indicates that places with a higher level of digitalization are more digitally accessible and easier to reach by individuals with higher levels of digital skills. The model simulates the interaction between dynamic agents and static agents (i.e., places), which captures how the gap between an individual’s digital skills and a place’s digitalization level can lead to the mobility or immobility of people to access different locations and services.
Wildlife-Human Interactions in Shared Landscapes (WHISL)
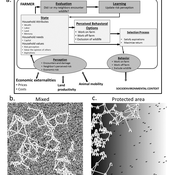
Nicholas Magliocca Neil Carter Andres Baeza-Castro | Published Friday, May 22, 2020This model simulates a group of farmers that have encounters with individuals of a wildlife population. Each farmer owns a set of cells that represent their farm. Each farmer must decide what cells inside their farm will be used to produce an agricultural good that is self in an external market at a given price. The farmer must decide to protect the farm from potential encounters with individuals of the wildlife population. This decision in the model is called “fencing”. Each time that a cell is fenced, the chances of a wildlife individual to move to that cell is reduced. Each encounter reduces the productive outcome obtained of the affected cell. Farmers, therefore, can reduce the risk of encounters by exclusion. The decision of excluding wildlife is made considering the perception of risk of encounters. In the model, the perception of risk is subjective, as it depends on past encounters and on the perception of risk from other farmers in the community. The community of farmers passes information about this risk perception through a social network. The user (observer) of the model can control the importance of the social network on the individual perception of risk.
Peer reviewed ABM for Social Cohesion and Wellbeing(ABMSCWB)
Taseer Salahuddin Hasan Vergil | Published Wednesday, June 25, 2025ABM model studying impact of social cohesion on wellbeing of a society. Ibn Khaldun’s cyclical theory of history is being used as the theoretical lens along with some other theories. Social cohesion is measured as TSC = (TVE + 2 * (TPI * TPL - TNI * TNL))/((TPI+TNI))
Where
TSC total-social-cohesion ; Variable for social cohesion
TPI total-positive-interactions ; Count of positive interactions
TNI total-negative-interactions ; Count of negative interactions
TPL total-positive-learning ; Count of positive learning outcomes
…
Neolithic Spread Model Version 1.0
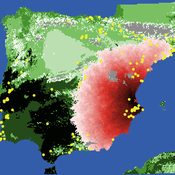
Sean Bergin Salvador Pardo Gordo Joan Bernabeu Auban Michael Barton | Published Thursday, December 11, 2014 | Last modified Monday, December 31, 2018This model simulates different spread hypotheses proposed for the introduction of agriculture on the Iberian peninsula. We include three dispersal types: neighborhood, leapfrog, and ideal despotic distribution (IDD).
Displaying 10 of 57 results for "Muhammad Abdullah Yasser" clear search