Our mission is to help computational modelers develop, document, and share their computational models in accordance with community standards and good open science and software engineering practices. Model authors can publish their model source code in the Computational Model Library with narrative documentation as well as metadata that supports open science and emerging norms that facilitate software citation, computational reproducibility / frictionless reuse, and interoperability. Model authors can also request private peer review of their computational models. Models that pass peer review receive a DOI once published.
All users of models published in the library must cite model authors when they use and benefit from their code.
Please check out our model publishing tutorial and feel free to contact us if you have any questions or concerns about publishing your model(s) in the Computational Model Library.
Displaying 7 of 17 results for "Bernhard Katzy" clear search
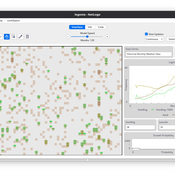
U-TRANS Modelling Urban Transition with Coupled Housing and Labour Markets
Bernardo Furtado Jiaqi Ge | Published Monday, July 31, 2023We develop an agent-based model (U-TRANS) to simulate the transition of an abstract city under an industrial revolution. By coupling the labour and housing markets, we propose a holistic framework that incorporates the key interacting factors and micro processes during the transition. Using U-TRANS, we look at five urban transition scenarios: collapse, weak recovery, transition, enhanced training and global recruit, and find the model is able to generate patterns observed in the real world. For example, We find that poor neighbourhoods benefit the most from growth in the new industry, whereas the rich neighbourhoods do better than the rest when the growth is slow or the situation deteriorates. We also find a (subtle) trade-off between growth and equality. The strategy to recruit a large number of skilled workers globally will lead to higher growth in GDP, population and human capital, but it will also entail higher inequality and market volatility, and potentially create a divide between the local and international workers. The holistic framework developed in this paper will help us better understand urban transition and detect early signals in the process. It can also be used as a test-bed for policy and growth strategies to help a city during a major economic and technological revolution.
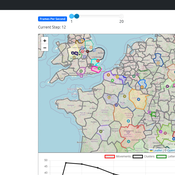
A simulation model for Dublin city
umesh7lowe | Published Friday, April 10, 2026An agent-based model of urban travel behaviour in Dublin, Ireland, built in NetLogo and empirically grounded in 2016 travel survey data. Each agent represents a Dublin resident initialised with real socio-demographic attributes — including age, gender, household size and car ownership, income, driving licence status, and access to local amenities — alongside observed trip characteristics such as distance, travel time, and trip type (work, shopping, leisure).
At each time step, agents choose between four transport modes (car, public transport, cycling, and walking) across short, medium, and long trips. Mode choice is governed by a preference vector that weighs personal need satisfaction against social influence from neighbouring agents reflecting consumat framework. Satisfaction evolves dynamically based on cost (incorporating Irish motor tax bands and per-km operating rates), travel time, and trip-type suitability, with an uncertainty parameter capturing variability in perceived utility over time.
The model tracks aggregate modal shares and total CO2 emission at each tick, enabling exploration of how policy interventions — such as fuel taxation, public transport pricing, or active travel incentives — might shift the city’s travel demand profile over 100 simulated days.
PolicySpace: agent-based modeling
Francisco Miguel Quesada Bernardo Furtado Isaque Daniel Rocha Eberhardt | Published Tuesday, March 06, 2018PolicySpace models public policies within an empirical, spatial environment using data from 46 metropolitan regions in Brazil. The model contains citizens, markets, residences, municipalities, commuting and a the tax scheme. In the associated publications (book in press and https://arxiv.org/abs/1801.00259) we validate the model and demonstrate an application of the fiscal analysis. Besides providing the basics of the platform, our results indicate the relevance of the rules of taxes transfer for cities’ quality of life.
Peer reviewed Historical Letters
Bernardo Buarque Malte Vogl Jascha Merijn Schmitz Aleksandra Kaye | Published Thursday, May 16, 2024 | Last modified Friday, May 24, 2024A letter sending model with historically informed initial positions to reconstruct communication and archiving processes in the Republic of Letters, the 15th to 17th century form of scholarship.
The model is aimed at historians, willing to formalize historical assumptions about the letter sending process itself and allows in principle to set heterogeneous social roles, e.g. to evaluate the role of gender or social status in the formation of letter exchange networks. The model furthermore includes a pruning process to simulate the loss of letters to critically asses the role of biases e.g. in relation to gender, geographical regions, or power structures, in the creation of empirical letter archives.
Each agent has an initial random topic vector, expressed as a RGB value. The initial positions of the agents are based on a weighted random draw based on data from [2]. In each step, agents generate two neighbourhoods for sending letters and potential targets to move towards. The probability to send letters is a self-reinforcing process. After each sending the internal topic of the receiver is updated as a movement in abstract space by a random amount towards the letters topic.
…
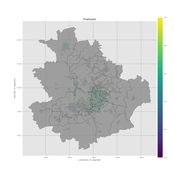
Logônia: Plant Growth Response Model in NetLogo
Daniel Vartanian Leandro Garcia Aline | Published Saturday, September 13, 2025 | Last modified Monday, July 13, 2026Logônia is a NetLogo model that simulates the growth response of a fictional plant, Logônia, under different climatic conditions. The model uses climate data from WorldClim 2.1 (Fick & Hijmans, 2017) and demonstrates how to integrate the LogoClim model through the LevelSpace extension.
The model was developed according to the FAIR principles for research software (Barker et al., 2022) and is openly available on the CoMSES Network and GitHub.
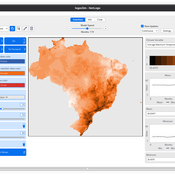
LogoClim: WorldClim in NetLogo
Daniel Vartanian Leandro Garcia Aline Martins de Carvalho Aline | Published Thursday, July 03, 2025 | Last modified Monday, July 13, 2026LogoClim is a NetLogo model designed to be integrated into other simulations through the LevelSpace extension (Hjorth et al., 2020), providing high resolution climate data from sources validated and used by the Intergovernmental Panel on Climate Change (IPCC).
The model simplifies and standardizes the integration of climate data into NetLogo, allowing researchers to focus their efforts on the model itself with the assurance of using reliable and widely recognized data. Although its main use is as a component of larger simulations, LogoClim also has its own graphical interface for monitoring and checking the datasets.
The climate data comes from the WorldClim 2.1 project (Fick & Hijmans, 2017), for which LogoClim works as an interface to NetLogo. The model supports all three WorldClim data series: (1) Historical Climate Data (1970 to 2000), with 12 monthly points for minimum, mean, and maximum temperature, precipitation, solar radiation, wind speed, vapor pressure, elevation, and bioclimatic variables; (2) Historical Monthly Weather Data (1951 to 2024), based on downscaling of CRU-TS-4.09, developed by the Climatic Research Unit at the University of East Anglia (Harris et al., 2020), with minimum and maximum temperature and total precipitation; and (3) Future Climate Data, based on downscaling climate projections derived from global climate models of the Coupled Model Intercomparison Project Phase 6 (CMIP6) (Eyring et al., 2016) for four future periods (2021 to 2040, 2041 to 2060, 2061 to 2080, and 2081 to 2100) and four scenarios based on the Shared Socioeconomic Pathways (SSPs 126, 245, 370, and 585), covering minimum and maximum temperature, total precipitation, and bioclimatic variables. All series are available at multiple spatial resolutions, from 10 minutes (about 340 km² at the equator) to 30 seconds (about 1 km² at the equator).
…

Peer reviewed Neighbor Influenced Energy Retrofit (NIER) agent-based model
Eric Boria | Published Friday, April 03, 2020The NIER model is intended to add qualitative variables of building owner types and peer group scales to existing energy efficiency retrofit adoption models. The model was developed through a combined methodology with qualitative research, which included interviews with key stakeholders in Cleveland, Ohio and Detroit and Grand Rapids, Michigan. The concepts that the NIER model adds to traditional economic feasibility studies of energy retrofit decision-making are differences in building owner types (reflecting strategies for managing buildings) and peer group scale (neighborhoods of various sizes and large-scale Districts). Insights from the NIER model include: large peer group comparisons can quickly raise the average energy efficiency values of Leader and Conformist building owner types, but leave Stigma-avoider owner types as unmotivated to retrofit; policy interventions such as upgrading buildings to energy-related codes at the point of sale can motivate retrofits among the lowest efficient buildings, which are predominantly represented by the Stigma-avoider type of owner; small neighborhood peer groups can successfully amplify normal retrofit incentives.
Displaying 7 of 17 results for "Bernhard Katzy" clear search