About the CoMSES Model Library more info
Our mission is to help computational modelers develop, document, and share their computational models in accordance with community standards and good open science and software engineering practices. Model authors can publish their model source code in the Computational Model Library with narrative documentation as well as metadata that supports open science and emerging norms that facilitate software citation, computational reproducibility / frictionless reuse, and interoperability. Model authors can also request private peer review of their computational models. Models that pass peer review receive a DOI once published.
All users of models published in the library must cite model authors when they use and benefit from their code.
Please check out our model publishing tutorial and feel free to contact us if you have any questions or concerns about publishing your model(s) in the Computational Model Library.
We also maintain a curated database of over 7500 publications of agent-based and individual based models with detailed metadata on availability of code and bibliometric information on the landscape of ABM/IBM publications that we welcome you to explore.
Displaying 10 of 486 results for "Tim M Daw" clear search
Peer reviewed Least cost path mobility
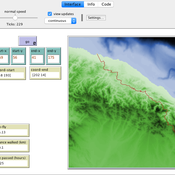
Colin Wren Claudine Gravel-Miguel | Published Saturday, September 02, 2017 | Last modified Monday, October 04, 2021This model aims to mimic human movement on a realistic topographical surface. The agent does not have a perfect knowledge of the whole surface, but rather evaluates the best path locally, at each step, thus mimicking imperfect human behavior.
Hominin Ecodynamics v.1.1 (update for perception and interaction)
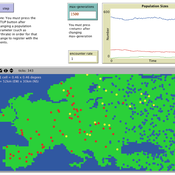
C Michael Barton | Published Wednesday, August 15, 2012 | Last modified Saturday, April 27, 2013Models land-use, perception, and biocultural interactions between two forager populations.
Peer reviewed Swidden Farming Version 2.0
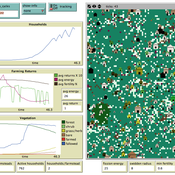
C Michael Barton | Published Wednesday, June 12, 2013 | Last modified Wednesday, September 03, 2014Model of shifting cultivation. All parameters can be controlled by the user or the model can be run in adaptive mode, in which agents innovate and select parameters.
The Bronze Age Collapse model (BACO model)
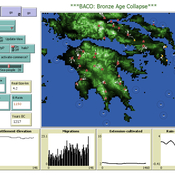
Marco Vidal-Cordasco | Published Friday, October 09, 2020The Bronze Age Collapse model (BACO model) is written using free NetLogo software v.6.0.3. The purpose of using the BACO model is to develop a tool to identify and analyse the main factors that made the Late Bronze Age and Early Iron Age socio-ecological system resilient or vulnerable in the face of the environmental aridity recorded in the Aegean. The model explores the relationship between dependent and independent variables. Independent variables are: a) inter-annual rainfall variability for the Late Bronze Age and Early Iron Age in the eastern Mediterranean, b) intensity of raiding, c) percentage of marine, agricultural and other calorie sources included in the diet, d) soil erosion processes, e) farming assets, and d) storage capacity. Dependent variables are: a) human pressure for land, b) settlement patterns, c) number of commercial exchanges, d) demographic behaviour, and e) number of migrations.
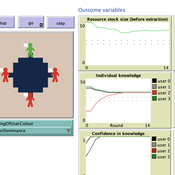
The purpose of the study is to unpack and explore a potentially beneficial role of sharing metacognitive information within a group when making repeated decisions about common pool resource (CPR) use.
We explore the explanatory power of sharing metacognition by varying (a) the individual errors in judgement (myside-bias); (b) the ways of reaching a collective judgement (metacognition-dependent), (c) individual knowledge updating (metacognition- dependent) and d) the decision making context.
The model (AgentEx-Meta) represents an extension to an existing and validated model reflecting behavioural CPR laboratory experiments (Schill, Lindahl & Crépin, 2015; Lindahl, Crépin & Schill, 2016). AgentEx-Meta allows us to systematically vary the extent to which metacognitive information is available to agents, and to explore the boundary conditions of group benefits of metacognitive information.
WOLVES - simulating wolf reappearance in the Netherlands
Kim van Vliet Zoë Delamore | Published Saturday, April 27, 2019This is an agent-based model, simulating wolf (Canis Lupus) reappearance in the Netherlands. The model’s purpose is to allow researchers to investigate the reappearance of wolves in the Netherlands and the possible effect of human interference. Wolf behaviour is modelled according to the literature. The suitability of the Dutch landscape for wolf settlement has been determined by Lelieveld (2012) [1] and is transformed into a colour-coded map of the Netherlands. The colour-coding is the main determinant of wolf settlement. Human involvement is modelled through the public opinion, which varies according to the size, composition and behaviour of the wolf population.
[1] Lelieveld, G.: Room for wolf comeback in the Netherlands, (2012).
Livestock drought insurance model
Birgit Müller Felix John Jürgen Groeneveld Karin Frank Russell Toth | Published Tuesday, December 19, 2017 | Last modified Saturday, April 14, 2018The model analyzes the economic and ecological effects of a provision of livestock drought insurance for dryland pastoralists. More precisely, it yields qualitative insights into how long-term herd and pasture dynamics change through insurance.
Salzburg Bicycle model
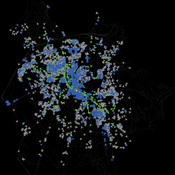
Gudrun Wallentin | Published Saturday, October 29, 2016An ABM to simulate the spatio-temporal distribution of cyclists across the road network of the city of Salzburg.
Rebel Group Protection Rackets
Gerd Wagner Luis Gustavo Nardin Kamil C. Klosek Frances Duffy | Published Wednesday, December 04, 2019System Narrative
How do rebel groups control territory and engage with the local economy during civil war? Charles Tilly’s seminal War and State Making as Organized Crime (1985) posits that the process of waging war and providing governance resembles that of a protection racket, in which aspiring governing groups will extort local populations in order to gain power, and civilians or businesses will pay in order to ensure their own protection. As civil war research increasingly probes the mechanisms that fuel local disputes and the origination of violence, we develop an agent-based simulation model to explore the economic relationship of rebel groups with local populations, using extortion racket interactions to explain the dynamics of rebel fighting, their impact on the economy, and the importance of their economic base of support. This analysis provides insights for understanding the causes and byproducts of rebel competition in present-day conflicts, such as the cases of South Sudan, Afghanistan, and Somalia.
Model Description
The model defines two object types: RebelGroup and Enterprise. A RebelGroup is a group that competes for power in a system of anarchy, in which there is effectively no government control. An Enterprise is a local civilian-level actor that conducts business in this environment, whose objective is to make a profit. In this system, a RebelGroup may choose to extort money from Enterprises in order to support its fighting efforts. It can extract payments from an Enterprise, which fears for its safety if it does not pay. This adds some amount of money to the RebelGroup’s resources, and they can return to extort the same Enterprise again. The RebelGroup can also choose to loot the Enterprise instead. This results in gaining all of the Enterprise wealth, but prompts the individual Enterprise to flee, or leave the model. This reduces the available pool of Enterprises available to the RebelGroup for extortion. Following these interactions the RebelGroup can choose to AllocateWealth, or pay its rebel fighters. Depending on the value of its available resources, it can add more rebels or expel some of those which it already has, changing its size. It can also choose to expand over new territory, or effectively increase its number of potential extorting Enterprises. As a response to these dynamics, an Enterprise can choose to Report expansion to another RebelGroup, which results in fighting between the two groups. This system shows how, faced with economic choices, RebelGroups and Enterprises make decisions in war that impact conflict and violence outcomes.
Spatio-Temporal Dynamic of Risk Model
J Jumadi | Published Tuesday, October 22, 2019 | Last modified Sunday, January 05, 2020This model aims to simlulate the dynamic of risk over time and space.
Displaying 10 of 486 results for "Tim M Daw" clear search
