Our mission is to help computational modelers develop, document, and share their computational models in accordance with community standards and good open science and software engineering practices. Model authors can publish their model source code in the Computational Model Library with narrative documentation as well as metadata that supports open science and emerging norms that facilitate software citation, computational reproducibility / frictionless reuse, and interoperability. Model authors can also request private peer review of their computational models. Models that pass peer review receive a DOI once published.
All users of models published in the library must cite model authors when they use and benefit from their code.
Please check out our model publishing tutorial and feel free to contact us if you have any questions or concerns about publishing your model(s) in the Computational Model Library.
Displaying 10 of 1019 results for "Rolf Anker Ims" clear search
Peer reviewed Axelrod_Cultural_Dissemination
Arezky Hernández | Published Wednesday, March 27, 2013 | Last modified Sunday, May 05, 2013The Axelrod’s model of cultural dissemination is an agent-model designed to investigate the dissemination of culture among interacting agents on a society.
Viability analysis of a population submitted to floods
Sophie Martin | Published Wednesday, September 22, 2021This model computes the guaranteed viability kernel of a model describing the evolution of a population submitted to successive floods.
The population is described by its wealth and its adaptation rate to floods, the control are information campaigns that have a cost but increase the adaptation rate and the expected successive floods belong to given set defined by the maximal high and the minimal time between two floods.
Netlogo Earned Value Management Model
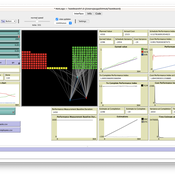
Manuel Castañón-Puga Ricardo Fernando Rosales–Cisneros Julio César Acosta–Prado Alfredo Tirado–Ramos Camilo Khatchikian Elías Aburto–Camacllanqui | Published Thursday, November 24, 2022The model aims to illustrate how Earned Value Management (EVM) provides an approach to measure a project’s performance by comparing its actual progress against the planned one, allowing it to evaluate trends to formulate forecasts. The instance performs a project execution and calculates the EVM performance indexes according to a Performance Measurement Baseline (PMB), which integrates the description of the work to do (scope), the deadlines for its execution (schedule), and the calculation of its costs and the resources required for its implementation (cost).
Specifically, we are addressing the following questions: How does the risk of execution delay or advance impact cost and schedule performance? How do the players’ number or individual work capacity impact cost and schedule estimations to finish? Regardless of why workers cause delays or produce overruns in their assignments, does EVM assess delivery performance and help make objective decisions?
To consider our model realistic enough for its purpose, we use the following patterns: The model addresses classic problems of Project Management (PM). It plays the typical task board where workers are assigned to complete a task backlog in project performance. Workers could delay or advance in the task execution, and we calculate the performance using the PMI-recommended Earned Value.
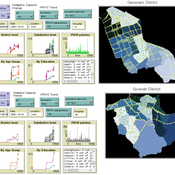
An Agent-based Assessment of Health Vulnerability to Long-term particulate exposure in Seoul Districts
Hyesop Shin Mike Bithell | Published Monday, November 05, 2018 | Last modified Monday, December 03, 2018This model aims to understand the cumulative effects on the population’s vulnerability as represented by exposure to PM10 (particulate matter with diameter less than 10 micrometres) by different age and educational groups in two Seoul districts, Gangnam and Gwanak. Using this model, readers can explore individual’s daily commuting routine, and its health loss when the PM10 concentration of the current patch breaches the national limit of 100µg/m3.
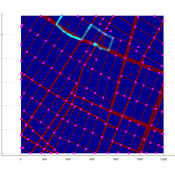
Agent-based model of WiFi tracking system in urban environment
Christopher Thron Khoi Tran | Published Friday, April 21, 2017This code simulates the WiFi user tracking system described in: Thron et al., “Design and Simulation of Sensor Networks for Tracking Wifi Users in Outdoor Urban Environments”. Testbenches used to create the figures in the paper are included.
SBH trust model
Di Wang | Published Tuesday, December 14, 2010 | Last modified Saturday, April 27, 2013This is a computational model to articulate the theory and test some assumption and axioms for the trust model and its relationship to SBH.
Peer reviewed Behavior changes through influence
Daria Soboleva | Published Friday, August 30, 2024The model is designed to simulate the behavior and decision-making processes of individuals (agents) in a social network. It aims to represent the changes in individual probability to take any action based on changes in attributes. The action is anything that can be reasonably influenced by the three influencing methods implemented in this model: peer pressure, social media, and state campaigns, and for which the user has a decision-making model. The model is implemented in the multi-agent programmable environment NetLogo 6.3.0.
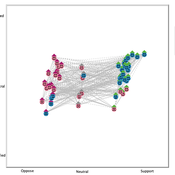
Gaming Polarisation: Using Agent-Based Simulations as A Dialogue Tool
Shaoni Wang | Published Friday, May 09, 2025This model aims to replicate the evolution of opinions and behaviours on a communal plan over time. It also aims to foster community dialogue on simulation outcomes, promoting inclusivity and engagement. Individuals (referred to as agents), grouped based on Sinus Milieus (Groh-Samberg et al., 2023), face a binary choice: support or oppose the plan. Motivated by experiential, social, and value needs (Antosz et al., 2019), their decision is influenced by how well the plan aligns with these fundamental needs.
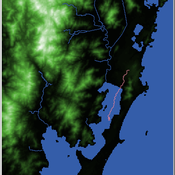
Shellmound Mobility
Henrique de Sena Kozlowski | Published Saturday, June 15, 2024Least Cost Path (LCP) analysis is a recurrent theme in spatial archaeology. Based on a cost of movement image, the user can interpret how difficult it is to travel around in a landscape. This kind of analysis frequently uses GIS tools to assess different landscapes. This model incorporates some aspects of the LCP analysis based on GIS with the capabilities of agent-based modeling, such as the possibility to simulate random behavior when moving. In this model the agent will travel around the coastal landscape of Southern Brazil, assessing its path based on the different cost of travel through the patches. The agents represent shellmound builders (sambaquieiros), who will travel mainly through the use of canoes around the lagoons.
How it works?
When the simulation starts the hiker agent moves around the world, a representation of the lagoon landscape of the Santa Catarina state in Southern Brazil. The agent movement is based on the travel cost of each patch. This travel cost is taken from a cost surface raster created in ArcMap to represent the different cost of movement around the landscape. Each tick the agent will have a chance to select the best possible patch to move in its Field of View (FOV) that will take it towards its target destination. If it doesn’t select the best possible patch, it will randomly choose one of the patches to move in its FOV. The simulation stops when the hiker agent reaches the target destination. The elevation raster file and the cost surface map are based on a 1 Arc-second (30m) resolution SRTM image, scaled down 5 times. Each patch represents a square of 150m, with an area of 0,0225km². The dataset uses a UTM Sirgas 2000 22S projection system. There are four different cost functions available to use. They change the cost surface used by the hikers to navigate around the world.
Agent-based Model of Industrial Evolution
Martin Zoričak Denis Horvath Vladimir Gazda Oto Hudec | Published Wednesday, July 10, 2019This is a conceptual model of underlying forces creating industrial clusters. There are two contradictory forces - attraction and repulsion. Firms within the same Industry are attracted to each other and on the other hand, firms with the same Activity are repulsed from each other. In each round firm with the lowest fitness is selected to change its profile of Industries and Activities. Based on these simple rules interesting patterns emerge.
Displaying 10 of 1019 results for "Rolf Anker Ims" clear search