Our mission is to help computational modelers develop, document, and share their computational models in accordance with community standards and good open science and software engineering practices. Model authors can publish their model source code in the Computational Model Library with narrative documentation as well as metadata that supports open science and emerging norms that facilitate software citation, computational reproducibility / frictionless reuse, and interoperability. Model authors can also request private peer review of their computational models. Models that pass peer review receive a DOI once published.
All users of models published in the library must cite model authors when they use and benefit from their code.
Please check out our model publishing tutorial and feel free to contact us if you have any questions or concerns about publishing your model(s) in the Computational Model Library.
Displaying 10 of 450 results for "Therese Lindahl" clear search
SMASH: Stylized Model of Agricultural Smallholder Households
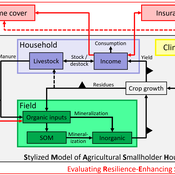
Tim Williams | Published Tuesday, December 08, 2020The SMASH model is an agent-based model of rural smallholder households. It models households’ evolving income and wealth, which they earn through crop sales. Wealth is carried in the form of livestock, which are grazed on an external rangeland (exogenous) and can be bought/sold as investment/coping mechanisms. The model includes a stylized representation of soil nutrient dynamics, modeling the inflows and outflows of organic and inorganic nitrogen from each household’s field.
The model has been applied to assess the resilience-enhancing effects of two different farm-level adaptation strategies: legume cover cropping and crop insurance. These two strategies interact with the model through different mechanims - legume cover cropping through ecological mechanisms and crop insurance through financial mechanisms. The model can be used to investigate the short- and long-term effects of these strategies, as well as how they may differently benefit different types of household.
Model of communication between two groups of managers in the course of project implementation
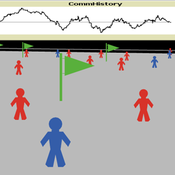
Smarzhevskiy Ivan | Published Monday, December 07, 2020This is a simulation model of communication between two groups of managers in the course of project implementation. The “world” of the model is a space of interaction between project participants, each of which belongs either to a group of work performers or to a group of customers. Information about the progress of the project is publicly available and represents the deviation Earned value (EV) from the planned project value (cost baseline).
The key elements of the model are 1) persons belonging to a group of customers or performers, 2) agents that are communication acts. The life cycle of persons is equal to the time of the simulation experiment, the life cycle of the communication act is 3 periods of model time (for the convenience of visualizing behavior during the experiment). The communication act occurs at a specific point in the model space, the coordinates of which are realized as random variables. During the experiment, persons randomly move in the model space. The communication act involves persons belonging to a group of customers and a group of performers, remote from the place of the communication act at a distance not exceeding the value of the communication radius (MaxCommRadius), while at least one representative from each of the groups must participate in the communication act. If none are found, the communication act is not carried out. The number of potential communication acts per unit of model time is a parameter of the model (CommPerTick).
The managerial sense of the feedback is the stimulating effect of the positive value of the accumulated communication complexity (positive background of the project implementation) on the productivity of the performers. Provided there is favorable communication (“trust”, “mutual understanding”) between the customer and the contractor, it is more likely that project operations will be performed with less lag behind the plan or ahead of it.
The behavior of agents in the world of the model (change of coordinates, visualization of agents’ belonging to a specific communicative act at a given time, etc.) is not informative. Content data are obtained in the form of time series of accumulated communicative complexity, the deviation of the earned value from the planned value, average indicators characterizing communication - the total number of communicative acts and the average number of their participants, etc. These data are displayed on graphs during the simulation experiment.
The control elements of the model allow seven independent values to be varied, which, even with a minimum number of varied values (three: minimum, maximum, optimum), gives 3^7 = 2187 different variants of initial conditions. In this case, the statistical processing of the results requires repeated calculation of the model indicators for each grid node. Thus, the set of varied parameters and the range of their variation is determined by the logic of a particular study and represents a significant narrowing of the full set of initial conditions for which the model allows simulation experiments.
…
This model extends the original Artifical Anasazi (AA) model to include individual agents, who vary in age and sex, and are aggregated into households. This allows more realistic simulations of population dynamics within the Long House Valley of Arizona from AD 800 to 1350 than are possible in the original model. The parts of this model that are directly derived from the AA model are based on Janssen’s 1999 Netlogo implementation of the model; the code for all extensions and adaptations in the model described here (the Artificial Long House Valley (ALHV) model) have been written by the authors. The AA model included only ideal and homogeneous “individuals” who do not participate in the population processes (e.g., birth and death)–these processes were assumed to act on entire households only. The ALHV model incorporates actual individual agents and all demographic processes affect these individuals. Individuals are aggregated into households that participate in annual agricultural and demographic cycles. Thus, the ALHV model is a combination of individual processes (birth and death) and household-level processes (e.g., finding suitable agriculture plots).
As is the case for the AA model, the ALHV model makes use of detailed archaeological and paleoenvironmental data from the Long House Valley and the adjacent areas in Arizona. It also uses the same methods as the original model (from Janssen’s Netlogo implementation) to estimate annual maize productivity of various agricultural zones within the valley. These estimates are used to determine suitable locations for households and farms during each year of the simulation.
One of four extensions to the standard Adder model that replicates a common type of transition experiment.
This is one of four extensions to the standard Adder model that replicate the various interventions typical of transition experiments.
One of four extensions to the standard Adder model that replicates the various interventions typically associated with transition experiments.
The fourth and final extension to the standard Adder model to replicate the various interventions typically associated with Transition Experiments.
SpeciesWorld
Tony Lawson | Published Friday, March 16, 2012 | Last modified Saturday, April 27, 2013How can species evolve a cooperative network to keep the environment suitable for life?
Peer reviewed Evolution of Ecological Communities: Testing Constraint Closure
Steve Peck | Published Sunday, December 06, 2020 | Last modified Friday, April 16, 2021Ecosystems are among the most complex structures studied. They comprise elements that seem both stable and contingent. The stability of these systems depends on interactions among their evolutionary history, including the accidents of organisms moving through the landscape and microhabitats of the earth, and the biotic and abiotic conditions in which they occur. When ecosystems are stable, how is that achieved? Here we look at ecosystem stability through a computer simulation model that suggests that it may depend on what constrains the system and how those constraints are structured. Specifically, if the constraints found in an ecological community form a closed loop, that allows particular kinds of feedback may give structure to the ecosystem processes for a period of time. In this simulation model, we look at how evolutionary forces act in such a way these closed constraint loops may form. This may explain some kinds of ecosystem stability. This work will also be valuable to ecological theorists in understanding general ideas of stability in such systems.
Reflexivity in a diffusion of innovations model
César García-Díaz Carlos Cordoba | Published Thursday, May 07, 2020In this agent-based model, agents decide to adopt a new product according to a utility function that depends on two kinds of social influences. First, there is a local influence exerted on an agent by her closest neighbors that have already adopted, and also by herself if she feels the product suits her personal needs. Second, there is a global influence which leads agents to adopt when they become aware of emerging trends happening in the system. For this, we endow agents with a reflexive capacity that allows them to recognize a trend, even if they can not perceive a significant change in their neighborhood.
Results reveal the appearance of slowdown periods along the adoption rate curve, in contrast with the classic stylized bell-shaped behavior. Results also show that network structure plays an important role in the effect of reflexivity: while some structures (e.g., scale-free networks) may amplify it, others (e.g., small-world structure) weaken such an effect.
Displaying 10 of 450 results for "Therese Lindahl" clear search