About the CoMSES Model Library more info
Our mission is to help computational modelers develop, document, and share their computational models in accordance with community standards and good open science and software engineering practices. Model authors can publish their model source code in the Computational Model Library with narrative documentation as well as metadata that supports open science and emerging norms that facilitate software citation, computational reproducibility / frictionless reuse, and interoperability. Model authors can also request private peer review of their computational models. Models that pass peer review receive a DOI once published.
All users of models published in the library must cite model authors when they use and benefit from their code.
Please check out our model publishing tutorial and feel free to contact us if you have any questions or concerns about publishing your model(s) in the Computational Model Library.
We also maintain a curated database of over 7500 publications of agent-based and individual based models with detailed metadata on availability of code and bibliometric information on the landscape of ABM/IBM publications that we welcome you to explore.
Displaying 10 of 184 results for "Ed Manley" clear search
Exploring Urban Shrinkage
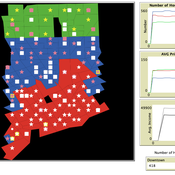
Andrew Crooks | Published Thursday, March 19, 2020While the world’s total urban population continues to grow, this growth is not equal. Some cities are declining, resulting in urban shrinkage which is now a global phenomenon. Many problems emerge due to urban shrinkage including population loss, economic depression, vacant properties and the contraction of housing markets. To explore this issue, this paper presents an agent-based model stylized on spatially explicit data of Detroit Tri-county area, an area witnessing urban shrinkage. Specifically, the model examines how micro-level housing trades impact urban shrinkage by capturing interactions between sellers and buyers within different sub-housing markets. The stylized model results highlight not only how we can simulate housing transactions but the aggregate market conditions relating to urban shrinkage (i.e., the contraction of housing markets). To this end, the paper demonstrates the potential of simulation to explore urban shrinkage and potentially offers a means to test polices to alleviate this issue.
Peer reviewed The OctoPINTS Model: Compliance and periodic fisheries closures (Beta)
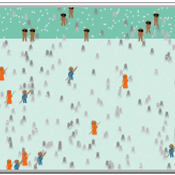
Emilie Lindkvist Maja Schlüter Tim M Daw Elizabeth Drury O'Neill Benedetta Veneroni Jineth Berrío-Martínez | Published Wednesday, April 20, 2022The purpose of the model is to explore how processes associated with compliance across different fishery actors’ social groups interplay with their acceptance of a fishery intervention, herein periodic closures of a small-scale octopus fishery. The model agents, entities and processes are designed based on stylized facts from literature and expert workshops on periodic closures in the Western Indian Ocean region, as well as fieldwork from Zanzibari villages that have implemented periodic octopus closures. The model is designed for scientists and decision-makers that are interested in understanding the complex interplay between fishers from different social groups, herein foot fisher men, foot fisher women and male skin divers or free divers within the periodic closure of an octopus species. Including various actions resulting from the restrictions, that is - opportunities that may be presented from restricting fishing in certain areas and during certain times. We are soon publishing an updated model with individual octopuses and their movement behaviors.
An Agent-Based Simulation of Continuous-Time Public Goods Games
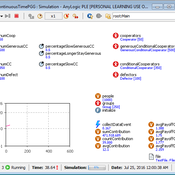
Tuong Manh Vu | Published Thursday, May 17, 2018 | Last modified Tuesday, April 02, 2019To our knowledge, this is the first agent-based simulation of continuous-time PGGs (where participants can change contributions at any time) which are much harder to realise within both laboratory and simulation environments.
Work related to this simulation has been published in the following journal article:
Vu, Tuong Manh, Wagner, Christian and Siebers, Peer-Olaf (2019) ‘ABOOMS: Overcoming the Hurdles of Continuous-Time Public Goods Games with a Simulation-Based Approach’ Journal of Artificial Societies and Social Simulation 22 (2) 7 http://jasss.soc.surrey.ac.uk/22/2/7.html. doi: 10.18564/jasss.3995
Abstract:
…
The Agent-Based Model of the Closed Market( similar to Stock Market) with One Commodity and with careful and risky mechanisms
Mark Voronovitsky | Published Sunday, March 15, 2015 | Last modified Sunday, March 22, 2015The model of market of one commodity , in which there are in each moment of time the same quantity and the same quantity of money was formulated and researched in this text. We also study this system as a game of automata.
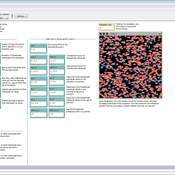
Cooling in simulated annealing using Metropolis' algorithm (version a & b)
María Pereda José Santos José Manuel Galán Virginia Ahedo | Published Monday, March 15, 2021Netlogo model that shows how the cooling process determines the quality of a solution in simulated annealing using Metropolis algorithm.
Will it spread or not? The effects of social influences and network topology on innovation diffusion
Sebastiano Delre | Published Monday, October 24, 2011 | Last modified Saturday, April 27, 2013This models simulates innovation diffusion curves and it tests the effects of the degree and the direction of social influences. This model replicates, extends and departs from classical percolation models.
Peer reviewed Garbage can model Excel reconstruction
Smarzhevskiy Ivan | Published Tuesday, August 19, 2014 | Last modified Tuesday, July 30, 2019Reconstruction of the original code M. Cohen, J. March, and J. Olsen garbage can model, realized by means of Microsoft Office Excel 2010
This is a social trust model for investigating the social relationships and social networks in the real world and in social media.
A model to explore the link between the gender-gap reversal in education and relative divorce risks
Jan Van Bavel Christine Schnor André Grow | Published Thursday, June 30, 2016 | Last modified Wednesday, September 13, 2017This model explores a social mechanism that links the reversal of the gender gap in education with changing patterns in relative divorce risks in 12 European countries.
SESPES: socio-ecological systems and payment for ecosystem services model
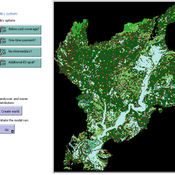
Eulàlia Baulenas | Published Sunday, December 20, 2020 | Last modified Sunday, December 20, 2020The purpose of this spatially-explicit agent-based model is to intervene in the debate about PES policy design, implementation and context. We use the case for a woodland-for-water payment for ecosystem services (PES) and model its implementation in a local area of Catalonia (NE Spain). The model is based on three sub-models. The structural contains four different designs of a PES policy. The social sub-model includes agent-based factors, by having four types of landowner categories managing or not the forests. This sub-model is based on behavioral studies and assumptions about reception and reaction to incentive policies from European-focused studies. The ecological sub-model is based on climate change data for the area. The output are the evolution of the ecological and social goals of the policy under different policy design scenarios. Our focus in Europe surges from the general context of land abandonment that many Mediterranean areas and Eastern countries are experiencing, and the growing interest from policy-makers and practitioners on the implementation of PES schemes to ameliorate this situation.
Displaying 10 of 184 results for "Ed Manley" clear search
