Our mission is to help computational modelers develop, document, and share their computational models in accordance with community standards and good open science and software engineering practices. Model authors can publish their model source code in the Computational Model Library with narrative documentation as well as metadata that supports open science and emerging norms that facilitate software citation, computational reproducibility / frictionless reuse, and interoperability. Model authors can also request private peer review of their computational models. Models that pass peer review receive a DOI once published.
All users of models published in the library must cite model authors when they use and benefit from their code.
Please check out our model publishing tutorial and feel free to contact us if you have any questions or concerns about publishing your model(s) in the Computational Model Library.
Displaying 10 of 236 results Netlogo clear search
Holmestrand School Model
Jessica Dimka | Published Friday, June 18, 2021 | Last modified Friday, April 29, 2022The Holmestrand model is an epidemiological agent-based model. Its aim is to test hypotheses related to how the social and physical environment of a residential school for children with disabilities might influence the spread of an infectious disease epidemic among students and staff. Annual reports for the Holmestrand School for the Deaf (Norway) are the primary sources of inspiration for the modeled school, with additional insights drawn from other archival records for schools for children with disabilities in early 20th century Norway and data sources for the 1918 influenza pandemic. The model environment consists of a simplified boarding school that includes residential spaces for students and staff, classrooms, a dining room, common room, and an outdoor area. Students and staff engage in activities reflecting hourly schedules suggested by school reports. By default, a random staff member is selected as the first case and is infected with disease. Subsequent transmission is determined by agent movement and interactions between susceptible and infectious pairs.
Mobility, Ethnicity, and Language-Based Immigrant Settlement Model - MELBIS
Liliana Perez Jonathan Gaudreau Suzana Dragicevic Taylor Anderson Aaron Leung | Published Monday, June 14, 2021 | Last modified Monday, June 14, 2021MELBIS-V1 is a spatially explicit agent-based model that allows the geospatial simulation of the decision-making process of newcomers arriving in the bilingual cities and boroughs of the island of Montreal, Quebec in CANADA, and the resulting urban segregation spatial patterns. The model was implemented in NetLogo, using geospatial raster datasets of 120m spatial resolution.
MELBIS-V2 enhances MELBIS-V1 to implement and simulate the decision-making processes of incoming immigrants, and to analyze the resulting spatial patterns of segregation as immigrants arrive and settle in various cities in Canada. The arrival and segregation of immigrants is modeled with MELBIS-V2 and compared for three major Canadian immigration gateways, including the City of Toronto, Metro Vancouver, and the City of Calgary.
Zombies
Jennifer Badham | Published Tuesday, June 08, 2021Zombies move toward humans and humans move (faster) away from zombies. They fight if they meet, and humans who lose become zombies.
EMMIT (Extendable Model for Malaria Intervention Testing)
Jacob Heintzelman Greg R Madey | Published Thursday, May 27, 2021EMMIT is an end-user developed agent-based simulation of malaria transmission. The simulation’s development is a case study demonstrating an approach for non-technical investigators to easily develop useful simulations of complex public health problems. We focused on malaria transmission, a major global public health problem, and insecticide resistance (IR), a major problem affecting malaria control. Insecticides are used to reduce transmission of malaria caused by the Plasmodium parasite that is spread by the Anopheles mosquito. However, the emergence and spread of IR in a mosquito population can diminish the insecticide’s effectiveness. IR results from mutations that produce behavioral changes or biochemical changes (such as detoxification enhancement, target site alterations) in the mosquito population that provide resistance to the insecticide. Evolutionary selection for the IR traits reduces the effectiveness of an insecticide favoring the resistant mosquito population. It has been suggested that biopesticides, and specifically those that are Late Life Acting (LLA), could address this problem. LLA insecticides exploit Plasmodium’s approximate 10-day extrinsic incubation period in the mosquito vector, a delay that limits malaria transmission to older infected mosquitoes. Since the proposed LLA insecticide delays mosquito death until after the exposed mosquito has a chance to produce several broods of offspring, reducing the selective pressure for resistance, it delays IR development and gives the insecticide longer effectivity. Such insecticides are designed to slow the evolution of IR thus maintaining their effectiveness for malaria control. For the IR problem, EMMIT shows that an LLA insecticide could work as intended, but its operational characteristics are critical, primarily the mean-time-to-death after exposure and the associated standard deviation. We also demonstrate the simulation’s extensibility to other malaria control measures, including larval source control and policies to mitigate the spread of IR. The simulation was developed using NetLogo as a case study of a simple but useful approach to public health research.
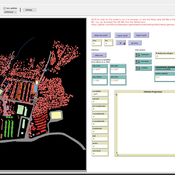
NetPlop: A moderately-featured presentation editor built in NetLogo
Patrick Steinmann | Published Saturday, March 27, 2021NetPlop is a presentation editor built entirely in NetLogo, an agent-based modelling environment. The NetPlop Editor includes a variety of tools to design slide decks, and the Viewer allows these decks to be dis-played to an enraptured audience. A key feature of NetPlop is the ability to embed agent-based models. NetPlop was developed for SIGBOVIK 2021.
AIforGoodSimulator - Modeling Covid-19 Spread and Potential Interventions in Refugee Camps
Shyaam Ramkumar Woi Sok Oh | Published Thursday, March 18, 2021The Netlogo model is a conceptualization of the Moria refugee camp, capturing the household demographics of refugees in the camp, a theoretical friendship network based on values, and an abstraction of their daily activities. The model then simulates how Covid-19 could spread through the camp if one refugee is exposed to the virus, utilizing transmission probabilities and the stages of disease progression of Covid-19 from susceptible to exposed to asymptomatic / symptomatic to mild / severe to recovered from literature. The model also incorporates various interventions - PPE, lockdown, isolation of symptomatic refugees - to analyze how they could mitigate the spread of the virus through the camp.
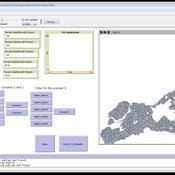
Cooling in simulated annealing using Metropolis' algorithm (version a & b)
María Pereda José Santos José Manuel Galán Virginia Ahedo | Published Monday, March 15, 2021Netlogo model that shows how the cooling process determines the quality of a solution in simulated annealing using Metropolis algorithm.
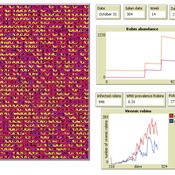
Peer reviewed AMRO_CULEX_WNV
Aniruddha Belsare Jennifer Owen | Published Saturday, February 27, 2021 | Last modified Thursday, March 11, 2021An agent-based model simulating West Nile Virus dynamics in a one host (American robin)-one vector (Culex spp. mosquito) system. ODD improved and code cleaned.
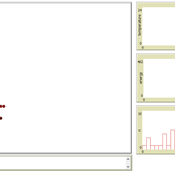
Hybrid agent-based methodology for testing response protocols
Fernando Sancho Caparrini | Published Wednesday, February 03, 2021In recent years we have seen multiple incidents with a large number of people injured and killed by one or more armed attackers. Since this type of violence is difficult to predict, detecting threats as early as possible allows to generate early warnings and reduce response time. In this context, any tool to check and compare different action protocols can be a further step in the direction of saving lives. Our proposal combines features from continuous and discrete models to obtain the best of both worlds in order to simulate large and crowded spaces where complex behavior individuals interact. With this proposal we aim to provide a tool for testing different security protocols under several emergency scenarios, where spaces, hazards, and population can be customized. Finally, we use a proof of concept implementation of this model to test specific security protocols under emergency situations for real spaces. Specifically, we test how providing some users of a university college with an app that informs about the type and characteristics of the ongoing hazard, affects in the safety performance.
Introducing two extensions of Schelling's segregation model
Andreas Flache Carlos A. de Matos Fernandes | Published Monday, January 25, 2021Schelling famously proposed an extremely simple but highly illustrative social mechanism to understand how strong ethnic segregation could arise in a world where individuals do not necessarily want it. Schelling’s simple computational model is the starting point for our extensions in which we build upon Wilensky’s original NetLogo implementation of this model. Our two NetLogo models can be best studied while reading our chapter “Agent-based Computational Models” (Flache and de Matos Fernandes, 2021). In the chapter, we propose 10 best practices to elucidate how agent-based models are a unique method for providing and analyzing formally precise, and empirically plausible mechanistic explanations of puzzling social phenomena, such as segregation, in the social world. Our chapter addresses in particular analytical sociologists who are new to ABMs.
In the first model (SegregationExtended), we build on Wilensky’s implementation of Schelling’s model which is available in NetLogo library (Wilensky, 1997). We considerably extend this model, allowing in particular to include larger neighborhoods and a population with four groups roughly resembling the ethnic composition of a contemporary large U.S. city. Further features added concern the possibility to include random noise, and the addition of a number of new outcome measures tuned to highlight macro-level implications of the segregation dynamics for different groups in the agent society.
In SegregationDiscreteChoice, we further modify the model incorporating in particular three new features: 1) heterogeneous preferences roughly based on empirical research categorizing agents into low, medium, and highly tolerant within each of the ethnic subgroups of the population, 2) we drop global thresholds (%-similar-wanted) and introduce instead a continuous individual-level single-peaked preference function for agents’ ideal neighborhood composition, and 3) we use a discrete choice model according to which agents probabilistically decide whether to move to a vacant spot or stay in the current spot by comparing the attractiveness of both locations based on the individual preference functions.
…
Displaying 10 of 236 results Netlogo clear search