Our mission is to help computational modelers develop, document, and share their computational models in accordance with community standards and good open science and software engineering practices. Model authors can publish their model source code in the Computational Model Library with narrative documentation as well as metadata that supports open science and emerging norms that facilitate software citation, computational reproducibility / frictionless reuse, and interoperability. Model authors can also request private peer review of their computational models. Models that pass peer review receive a DOI once published.
All users of models published in the library must cite model authors when they use and benefit from their code.
Please check out our model publishing tutorial and feel free to contact us if you have any questions or concerns about publishing your model(s) in the Computational Model Library.
Displaying 10 of 966 results for "P Van Geert" clear search
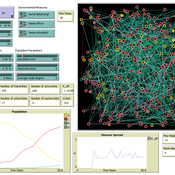
The Effect of Different Governmental Pandemic Control Measures on the Spread of a Virus Disease
Chiara Letter | Published Wednesday, January 26, 2022In this model, the spread of a virus disease in a network consisting of school pupils, employed, and umemployed people is simulated. The special feature in this model is the distinction between different types of links: family-, friends-, school-, or work-links. In this way, different governmental measures can be implemented in order to decelerate or stop the transmission.
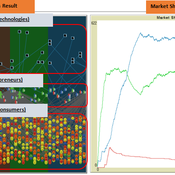
The simulation on the study of the optimal business strategy with the interaction between technologies and consumers.
sej-yoo | Published Monday, June 27, 2022 | Last modified Monday, July 04, 2022HOW IT WORKS
This model consists of three agents, and each agent type operates per business theories as below.
a. New technologies(Tech): It evolves per sustaining or disruptive technology trajectory with the constraint of project management triangle (Scope, Time, Quality, and Cost).
b. Entrepreneurs(Entre): It builds up the solution by combining Tech components per its own strategy (Exploration, Exploitation, or Ambidex).
c. Consumer(Consumer): It selects the solution per its own preference due to Diffusion of innovation theory (Innovators, Early Adopters, Early Majority, Late Majority, Laggards)
…
Integrate land use policies into the agent-based model to simulate land use change
Jing Gao | Published Sunday, June 09, 2024This study employs a hierarchical cross-departmental ABM to explore the question: How and to what extent are the land use policies enforced when assessed against the real-world land use pattern? Specifically, two sub-questions are of interest: How can real-world policy interactions be abstracted into the behavior across hierarchical governmental departments in the model? How can the level of enforcement for each land use policy be quantified under these interactions? We build three hierarchical agents—the central level, the local level that incorporates three departments, and the village collective level—with simplified but plausible processes of land use change, with levels of enforcement of different land use policies as key parameters. We calibrate the model using a genetic algorithm to determine those parameters and answer our research question. We further applied the model to simulate potential land use changes and investigate the implications of different policy options. The results are expected to provide insights into the intricate relationships shaping land use processes, contributing to evidence-based decision-making in urban planning and sustainable land use management.
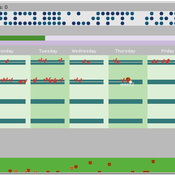
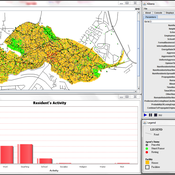
Health and social public information office (SPUN) simulation
Emilio Sulis Manuela Vinai | Published Friday, November 06, 2015 | Last modified Saturday, November 07, 2015The program simulate the functioning of an italian health and social public information office (SPUN) on the basis of the real data collected in the first five years of functioning.
SMILI-T: Small-scale fisheries institutions and local interactions for transformations
Emilie Lindkvist Maja Schlüter Xavier Basurto | Published Tuesday, January 09, 2018 | Last modified Friday, March 26, 2021This model examines how financial and social top-down interventions interplay with the internal self-organizing dynamics of a fishing community. The aim is to transform from hierarchical fishbuyer-fisher relationship into fishing cooperatives.
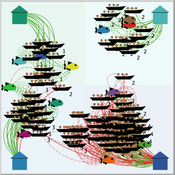
Peer reviewed FishMob: Interactions between fisher mobility and spatial resource heterogeneity
Emilie Lindkvist | Published Wednesday, October 16, 2019 | Last modified Tuesday, June 23, 2020Migration or other long-distance movement into other regions is a common strategy of fishers and fishworkers living and working on the coast to adapt to environmental change. This model attempts to understand the general dynamics of fisher mobility for over larger spatial scales. The model can be used for investigating the complex interplay that exists between mobility and fish stock heterogeneity across regions, and the associated outcomes of mobility at the system level.
The model design informed by the example of small-scale fisheries in the Gulf of California, Mexico but implements theoretical and stylized facts and can as such be used for different archetypical cases. Our methodological approach for designing the model aims to account for the complex causation, emergence and interdependencies in small-scale fisheries to explain the phenomenon of sequential overexploitation, i.e., overexploiting one resource after another. The model is intended to be used as a virtual laboratory to investigate when and how different levels of mobile fishers affect exploitation patterns of fisheries resources.
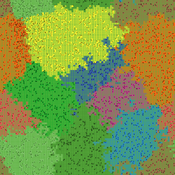
Peer reviewed Lethal Geometry
Kristin Crouse | Published Friday, February 21, 2020 | Last modified Wednesday, December 15, 2021LethalGeometry was developed to examine whether territory size influences the mortality risk for individuals within that territory. For animals who live in territoral groups and are lethally aggressive, we can expect that most aggression occurs along the periphery (or border) between two adjacent territories. For territories that are relatively large, the periphery makes up a proportionately small amount of the of the total territory size, suggesting that individuals in these territories might be less likely to die from these territorial skirmishes. LethalGeometry examines this geometric relationship between territory size and mortality risk under realistic assumptions of variable territory size and shape, variable border width, and stochastic interactions and movement.
The individuals (agents) are programmed to walk randomly about their environment, search for and eat food to obtain energy, reproduce if they can, and act aggressively toward individuals of other groups. During each simulation step, individuals analyze their environment and internal state to determine which actions to take. The actions available to individuals include moving, fighting, and giving birth.
Agent-Based Model of Social Care with Kinship Networks
Umberto Gostoli Eric Silverman | Published Thursday, October 14, 2021The purpose of this model is the simulation of social care provision in the UK, in which individual agents can decide to provide informal care, or pay for private care, for their loved ones. Agents base these decisions on factors including their own health, employment status, financial resources, relationship to the individual in need and geographical location. The model simulates care provision as a negotiation process conducted between agents across their kinship networks, with agents with stronger familial relationships to the recipient being more likely to attempt to allocate time to care provision. The model also simulates demographic change, the impact of socioeconomic status, and allows agents to relocate and change jobs or reduce working hours in order to provide care.
Despite the relative lack of empirical data in this model, the model is able to reproduce plausible patterns of social care provision. The inclusion of detailed economic and behavioural mechanisms allows this model to serve as a useful policy development tool; complex behavioural interventions can be implemented in simulation and tested on a virtual population before applying them in real-world contexts.
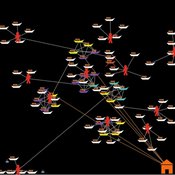
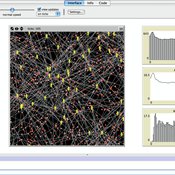
Modeling the Emergence of Riots
Andrew Crooks Bianica Pires | Published Wednesday, January 20, 2016 | Last modified Wednesday, September 21, 2016The purpose of the model is to explore how the unique socioeconomic variables underlying Kibera, local interactions, and the spread of a rumor, may trigger a riot.
Agent-based Simulation of Time Management
Hang Xiong | Published Thursday, March 24, 2016 | Last modified Friday, March 25, 2016This model simulates how the strategy one manages time affect the well-being that he/she can obtain.
Displaying 10 of 966 results for "P Van Geert" clear search