Our mission is to help computational modelers develop, document, and share their computational models in accordance with community standards and good open science and software engineering practices. Model authors can publish their model source code in the Computational Model Library with narrative documentation as well as metadata that supports open science and emerging norms that facilitate software citation, computational reproducibility / frictionless reuse, and interoperability. Model authors can also request private peer review of their computational models. Models that pass peer review receive a DOI once published.
All users of models published in the library must cite model authors when they use and benefit from their code.
Please check out our model publishing tutorial and feel free to contact us if you have any questions or concerns about publishing your model(s) in the Computational Model Library.
Displaying 10 of 966 results for "P Van Geert" clear search
Co-evolution of mental models among socially learning agents
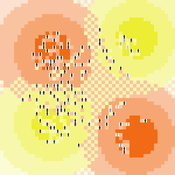
Garry Sotnik | Published Sunday, October 14, 2018The model simulates seven agents engaging in collective action and inter-network social learning. The objective of the model is to demonstrate how mental models of agents can co-evolve through a complex relationship among factors influencing decision-making, such as access to knowledge and personal- and group-level constraints.
SugarscapeCW
Christopher Watts | Published Saturday, August 01, 2015 | Last modified Wednesday, April 12, 2023A replication in Netlogo 5.2 of the classic model, Sugarscape (Epstein & Axtell, 1996).
The Targeted Subsidies Plan Model
Hassan Bashiri | Published Thursday, September 21, 2023The targeted subsidies plan model is based on the economic concept of targeted subsidies.
The targeted subsidies plan model simulates the distribution of subsidies among households in a community over several years. The model assumes that the government allocates a fixed amount of money each year for the purpose of distributing cash subsidies to eligible households. The eligible households are identified by dividing families into 10 groups based on their income, property, and wealth. The subsidy is distributed to the first four groups, with the first group receiving the highest subsidy amount. The model simulates the impact of the subsidy distribution process on the income and property of households in the community over time.
The model simulates a community of 230 households, each with a household income and wealth that follows a power-law distribution. The number of household members is modeled by a normal distribution. The model allocates a fixed amount of money each year for the purpose of distributing cash subsidies among eligible households. The eligible households are identified by dividing families into 10 groups based on their income, property, and wealth. The subsidy is distributed to the first four groups, with the first group receiving the highest subsidy amount.
The model runs for a period of 10 years, with the subsidy distribution process occurring every month. The subsidy received by each household is assumed to be spent, and a small portion may be saved and added to the household’s property. At the end of each year, the grouping of households based on income and assets is redone, and a number of families may be moved from one group to another based on changes in their income and property.
…
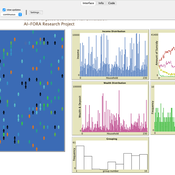
Peer reviewed Historical Letters
Bernardo Buarque Malte Vogl Jascha Merijn Schmitz Aleksandra Kaye | Published Thursday, May 16, 2024 | Last modified Friday, May 24, 2024A letter sending model with historically informed initial positions to reconstruct communication and archiving processes in the Republic of Letters, the 15th to 17th century form of scholarship.
The model is aimed at historians, willing to formalize historical assumptions about the letter sending process itself and allows in principle to set heterogeneous social roles, e.g. to evaluate the role of gender or social status in the formation of letter exchange networks. The model furthermore includes a pruning process to simulate the loss of letters to critically asses the role of biases e.g. in relation to gender, geographical regions, or power structures, in the creation of empirical letter archives.
Each agent has an initial random topic vector, expressed as a RGB value. The initial positions of the agents are based on a weighted random draw based on data from [2]. In each step, agents generate two neighbourhoods for sending letters and potential targets to move towards. The probability to send letters is a self-reinforcing process. After each sending the internal topic of the receiver is updated as a movement in abstract space by a random amount towards the letters topic.
…
The SAFIRe model : Simulation of Agents for Fertility, Integrated Energy, Food security, and Reforestation
Etienne DELAY Lucas Broutin | Published Thursday, June 12, 2025The SAFIRe model (Simulation of Agents for Fertility, Integrated Energy, Food Security, and Reforestation) is an agent-based model co-developed with rural communities in Senegal’s Groundnut Basin. Its purpose is to explore how local farming and pastoral practices affect the regeneration of Faidherbia albida trees, which are essential for maintaining soil fertility and supporting food security through improved millet production. The model supports collective reflection on how different social and ecological factors interact, particularly around firewood demand, livestock pressure, and agricultural intensification.
The model simulates a 100-hectare agricultural landscape where agents (farmers, shepherds, woodcutters, and supervisors) interact with trees, land parcels, and each other. It incorporates seasonality, crop rotation, tree growth and cutting, livestock feeding behaviors, and farmers’ engagement in sapling protection through Assisted Natural Regeneration (ANR). Two types of surveillance strategies are compared: community-led monitoring and delegated surveillance by forestry authorities. Farmer engagement evolves over time based on peer influence, meeting participation, and the success of visible tree regeneration efforts.
SAFIRe integrates participatory modeling (ComMod and ComExp) and a backcasting approach (ACARDI) to co-produce scenarios rooted in local aspirations. It was explored using the OpenMole platform, allowing stakeholders to test a wide range of future trajectories and analyze the sensitivity of key parameters (e.g., discussion frequency, time in fields). The model’s outcomes not only revealed unexpected insights—such as the hidden role of farmers in tree loss—but also led to real-world actions, including community nursery creation and behavioral shifts toward tree care. SAFIRe illustrates how agent-based modeling can become a tool for social learning and collective action in socio-ecological systems.
Venues and Segregation: A Revised Schelling Model
Ultan Byrne | Published Thursday, August 06, 2020This model examines an important but underappreciated mechanism affecting urban segregation and integration: urban venues. The venue- an area where urbanites interact- is an essential aspect of city life that tends to influence how satisfactory any location is. We study the venue/segregation relationship by installing venues into Schelling’s classic agent-based segregation model.
Root disease model
Adam Bouche | Published Sunday, September 30, 2018This is a model of root disease spread between trees in the landscape. The disease spreads via two transmission processes: (a) root contact/root graft transmission between adjacent trees and (b) insect vectors that carry spores between trees. Full details can be found in the “Info” tab in the model and in the readme file in the GitHub repository.
COVID-19 ABM
Gudrun Wallentin | Published Tuesday, April 21, 2020 | Last modified Tuesday, April 21, 2020Model of the Corona pandemic outbreak
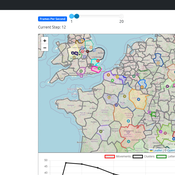
The COVID-19 ABM aims to predict the qualitative behaviour of the CoViD-19 epidemic dynamics for the greater region of Salzburg City. Specifically, by means of scenario testing, it aims to help assessing how containment interventions can allow a stepwise relaxation of the lockdown without risking a new outbreak.
Virus Spread on Broad-degree-distribution Network.
Gianluca Manzo | Published Friday, July 24, 2020The model simulates the spread of a virus through a synthetic network with a degree distribution calibrated on close-range contact data. The model is used to study the macroscopic consequences of cross-individual variability in close-range contact frequencies and to assess whether this variability can be exploited for effective intervention targeting high-contact nodes.
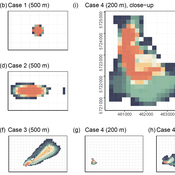
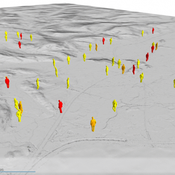
The Agent-Based Wildfire Simulation Environment (ABWiSE) translates the concept of a moving fire front as a set of mobile fire agents that respond to, and interact with, vegetation, wind, and terrain. Presently, the purpose of ABWiSE is to explore how ABM, using simple interactions between agents and a simple atmospheric feedback model, can simulate emergent fire spread patterns.
Displaying 10 of 966 results for "P Van Geert" clear search