Our mission is to help computational modelers develop, document, and share their computational models in accordance with community standards and good open science and software engineering practices. Model authors can publish their model source code in the Computational Model Library with narrative documentation as well as metadata that supports open science and emerging norms that facilitate software citation, computational reproducibility / frictionless reuse, and interoperability. Model authors can also request private peer review of their computational models. Models that pass peer review receive a DOI once published.
All users of models published in the library must cite model authors when they use and benefit from their code.
Please check out our model publishing tutorial and feel free to contact us if you have any questions or concerns about publishing your model(s) in the Computational Model Library.
Displaying 10 of 1195 results for "Aad Kessler" clear search
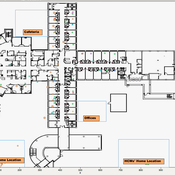
Knowledge Sharing in a Hospital
bpint Emily Molfino Joshua Goldstein Kathryn Schaefer Ziemer Mark Orr Bryan Lewis Jose Jimenez | Published Friday, January 27, 2023Organizations are complex systems comprised of many dynamic and evolving interaction patterns among individuals and groups. Understanding these interactions and how patterns, such as informal structures and knowledge sharing behavior, emerge are crucial to creating effective and efficient organizations. To explore such organizational dynamics, the agent-based model integrates a cognitive model, dynamic social networks, and a physical environment.
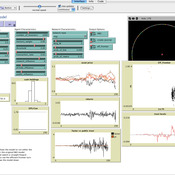
Multi Asset Variable Network Stock Market Model
Matthew Oldham | Published Monday, September 12, 2016 | Last modified Tuesday, October 10, 2017An artifcal stock market model that allows users to vary the number of risky assets as well as the network topology that investors forms in an attempt to understand the dynamics of the market.
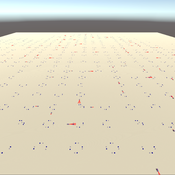
3D Urban Traffic Simulator (ABM) in Unity
Daniel Birks Sedar Olmez Obi Thompson Sargoni Alison Heppenstall Annabel Whipp Ed Manley | Published Friday, January 22, 2021 | Last modified Monday, March 22, 2021The Urban Traffic Simulator is an agent-based model developed in the Unity platform. The model allows the user to simulate several autonomous vehicles (AVs) and tune granular parameters such as vehicle downforce, adherence to speed limits, top speed in mph and mass. The model allows researchers to tune these parameters, run the simulator for a given period and export data from the model for analysis (an example is provided in Jupyter Notebook).
The data the model is currently able to output are the following:
…
Software for an agent-based game-theoretic model of the contact hypothesis of prejudice reduction, to accompany “Modeling Prejudice Reduction,” in the Handbook of Computational Social Psychology, adapted from Public Affairs Quarterly 19 (2) 2005.
Evolution of Conditional Cooperation
M Manning Marco Janssen Oyita Udiani | Published Thursday, August 01, 2013 | Last modified Friday, May 13, 2022Cultural group selection model used to evaluate the conditions for agents to evolve who have other-regarding preferences in making decisions in public good games.
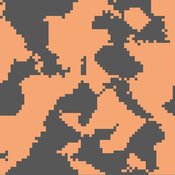
A Multi-level Multi-model of Collective Motion
Benjamin Camus Christine Bourjot Vincent Chevrier | Published Wednesday, March 25, 2015This multi-model (i.e. a model composed of interacting submodels) is a multi-level representation of a collective motion phenomenon. It was designed to study the impact of the mutual influences between individuals and groups in collective motion.
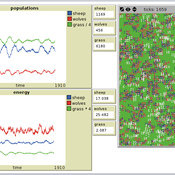
Peer reviewed PPHPC - Predator-Prey for High-Performance Computing
Nuno Fachada | Published Saturday, August 08, 2015 | Last modified Wednesday, November 25, 2015PPHPC is a conceptual model for studying and evaluating implementation strategies for spatial agent-based models (SABMs). It is a realization of a predator-prey dynamic system, and captures important SABMs characteristics.
LimnoSES - social-ecological lake management undergoing regime shifts
Romina Martin | Published Thursday, November 24, 2016 | Last modified Friday, January 18, 2019LimnoSES is a coupled system dynamics, agent-based model to simulate social-ecological feedbacks in shallow lake use and management.
A simple Multi-Agent System of the Tragedy Of the Commons (MASTOC-s)
Julia Schindler | Published Friday, June 29, 2012 | Last modified Saturday, April 27, 2013This is a simple model replicating Hardin’s Tragedy of the Commons using reactive agents that have psychological behavioral and social preferences.
Parallel trading systems
Marcin Czupryna | Published Friday, June 26, 2020The model simulates agents behaviour in wine market parallel trading systems: auctions, OTC and Liv-ex. Models are written in JAVA and use MASON framework. To run a simulation download source files with additional src folder with sobol.csv file. In WineSimulation.java set RESULTS_FOLDER parameter. Uses following external libraries mason19..jar, opencsv.jar, commons-lang3-3.5.jar and commons-math3-3.6.1.jar.
Displaying 10 of 1195 results for "Aad Kessler" clear search