About the CoMSES Model Library more info
Our mission is to help computational modelers develop, document, and share their computational models in accordance with community standards and good open science and software engineering practices. Model authors can publish their model source code in the Computational Model Library with narrative documentation as well as metadata that supports open science and emerging norms that facilitate software citation, computational reproducibility / frictionless reuse, and interoperability. Model authors can also request private peer review of their computational models. Models that pass peer review receive a DOI once published.
All users of models published in the library must cite model authors when they use and benefit from their code.
Please check out our model publishing tutorial and feel free to contact us if you have any questions or concerns about publishing your model(s) in the Computational Model Library.
We also maintain a curated database of over 7500 publications of agent-based and individual based models with detailed metadata on availability of code and bibliometric information on the landscape of ABM/IBM publications that we welcome you to explore.
Displaying 10 of 1173 results for "Aad Kessler" clear search
Evolution of Conditional Cooperation
M Manning Marco Janssen Oyita Udiani | Published Thursday, August 01, 2013 | Last modified Friday, May 13, 2022Cultural group selection model used to evaluate the conditions for agents to evolve who have other-regarding preferences in making decisions in public good games.
A Multi-level Multi-model of Collective Motion
Benjamin Camus Christine Bourjot Vincent Chevrier | Published Wednesday, March 25, 2015This multi-model (i.e. a model composed of interacting submodels) is a multi-level representation of a collective motion phenomenon. It was designed to study the impact of the mutual influences between individuals and groups in collective motion.
Peer reviewed PPHPC - Predator-Prey for High-Performance Computing
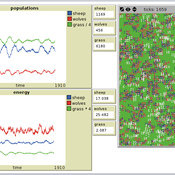
Nuno Fachada | Published Saturday, August 08, 2015 | Last modified Wednesday, November 25, 2015PPHPC is a conceptual model for studying and evaluating implementation strategies for spatial agent-based models (SABMs). It is a realization of a predator-prey dynamic system, and captures important SABMs characteristics.
Software for an agent-based game-theoretic model of the contact hypothesis of prejudice reduction, to accompany “Modeling Prejudice Reduction,” in the Handbook of Computational Social Psychology, adapted from Public Affairs Quarterly 19 (2) 2005.
LimnoSES - social-ecological lake management undergoing regime shifts
Romina Martin | Published Thursday, November 24, 2016 | Last modified Friday, January 18, 2019LimnoSES is a coupled system dynamics, agent-based model to simulate social-ecological feedbacks in shallow lake use and management.
Parallel trading systems
Marcin Czupryna | Published Friday, June 26, 2020The model simulates agents behaviour in wine market parallel trading systems: auctions, OTC and Liv-ex. Models are written in JAVA and use MASON framework. To run a simulation download source files with additional src folder with sobol.csv file. In WineSimulation.java set RESULTS_FOLDER parameter. Uses following external libraries mason19..jar, opencsv.jar, commons-lang3-3.5.jar and commons-math3-3.6.1.jar.
Peer reviewed MIOvCWD
Aniruddha Belsare | Published Friday, December 13, 2019MIOvCWD is a spatially-explicit, agent-based model designed to simulate the spread of chronic wasting disease (CWD) in Michigan’s white-tailed deer populations. CWD is an emerging prion disease of North American cervids (white-tailed deer Odocoileus virginianus, mule deer Odocoileus hemionus, and elk Cervus elaphus) that is being actively managed by wildlife agencies in most states and provinces in North America, including Michigan. MIOvCWD incorporates features like deer population structure, social organization and behavior that are particularly useful to simulate CWD dynamics in regional deer populations.
The Agent-Based Wildfire Simulation Environment (ABWiSE) translates the concept of a moving fire front as a set of mobile fire agents that respond to, and interact with, vegetation, wind, and terrain. Presently, the purpose of ABWiSE is to explore how ABM, using simple interactions between agents and a simple atmospheric feedback model, can simulate emergent fire spread patterns.
Peer reviewed Modelling Agricultural Innovations as a Social-Ecological Phenomenon
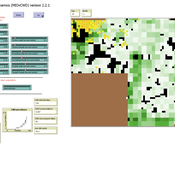
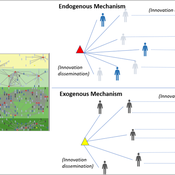
Maja Schlüter Udita Sanga | Published Thursday, November 17, 2022The goal of the AG-Innovation agent-based model is to explore and compare the effects of two alternative mechanisms of innovation development and diffusion (exogenous, linear and endogenous, non-linear) on emergent properties of food and income distribution and adoption rates of different innovations. The model also assesses the range of conditions under which these two alternative mechanisms would be effective in improving food security and income inequality outcomes. Our modelling questions were: i) How do cross-scalar social-ecological interactions within agricultural innovation systems affect system outcomes of food security and income inequality? ii) Do foreign aid-driven exogenous innovation perpetuate income inequality and food insecurity and if so, under which conditions? iii) Do community-driven endogenous innovations improve food security and income inequality and if so, under which conditions? The Ag-Innovation model is intended to serve as a thinking tool for for the development and testing of hypotheses, generating an understanding of the behavior of agricultural innovation systems, and identifying conditions under which alternated innovation mechanisms would improve food security and income inequality outcomes.
Sandy Beach Visitor Flow: An Agent-Based Model
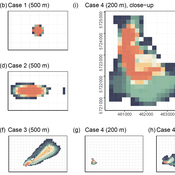
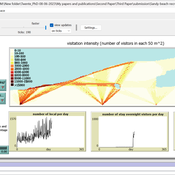
Elham Bakhshianlamouki | Published Thursday, March 14, 2024The model is intended to simulate visitor spatial and temporal dynamics, encompassing their numbers, activities, and distribution along a coastline influenced by beach landscape design. Our primary focus is understanding how the spatial distribution of services and recreational facilities (e.g., beach width, entrance location, recreational facilities, parking availability) impacts visitation density. Our focus is not on tracking the precise visitation density but rather on estimating the areas most affected by visitor activity. This comprehension allows for assessing the diverse influences of beach layouts on spatial visitor density and, consequently, on the landscape’s biophysical characteristics (e.g., vegetation, fauna, and sediment features).
Displaying 10 of 1173 results for "Aad Kessler" clear search
