Our mission is to help computational modelers develop, document, and share their computational models in accordance with community standards and good open science and software engineering practices. Model authors can publish their model source code in the Computational Model Library with narrative documentation as well as metadata that supports open science and emerging norms that facilitate software citation, computational reproducibility / frictionless reuse, and interoperability. Model authors can also request private peer review of their computational models. Models that pass peer review receive a DOI once published.
All users of models published in the library must cite model authors when they use and benefit from their code.
Please check out our model publishing tutorial and feel free to contact us if you have any questions or concerns about publishing your model(s) in the Computational Model Library.
Displaying 10 of 43 results for "Nick Gotts" clear search
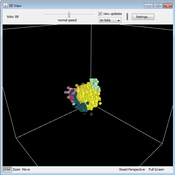
A Simulation of Entrepreneurial Spawning
Mark Bagley | Published Wednesday, June 08, 2016 | Last modified Friday, June 30, 2017Industrial clustering patterns are the result of an entrepreneurial process where spinoffs inherit the ideas and attributes of their parent firms. This computational model maps these patterns using abstract methodologies.
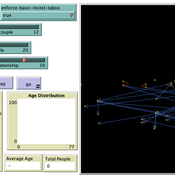
Peer reviewed Monogamous Reproduction in Small Populations and the Enforcement of the Incest Taboo
Ian Stuart | Published Wednesday, January 18, 2023This program was developed to simulate monogamous reproduction in small populations (and the enforcement of the incest taboo).
Every tick is a year. Adults can look for a mate and enter a relationship. Adult females in a Relationship (under the age of 52) have a chance to become pregnant. Everyone becomes not alive at 77 (at which point people are instead displayed as flowers).
User can select a starting-population. The starting population will be adults between the ages of 18 and 42.
…
Shellmound Mobility
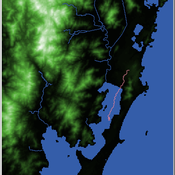
Henrique de Sena Kozlowski | Published Saturday, June 15, 2024Least Cost Path (LCP) analysis is a recurrent theme in spatial archaeology. Based on a cost of movement image, the user can interpret how difficult it is to travel around in a landscape. This kind of analysis frequently uses GIS tools to assess different landscapes. This model incorporates some aspects of the LCP analysis based on GIS with the capabilities of agent-based modeling, such as the possibility to simulate random behavior when moving. In this model the agent will travel around the coastal landscape of Southern Brazil, assessing its path based on the different cost of travel through the patches. The agents represent shellmound builders (sambaquieiros), who will travel mainly through the use of canoes around the lagoons.
How it works?
When the simulation starts the hiker agent moves around the world, a representation of the lagoon landscape of the Santa Catarina state in Southern Brazil. The agent movement is based on the travel cost of each patch. This travel cost is taken from a cost surface raster created in ArcMap to represent the different cost of movement around the landscape. Each tick the agent will have a chance to select the best possible patch to move in its Field of View (FOV) that will take it towards its target destination. If it doesn’t select the best possible patch, it will randomly choose one of the patches to move in its FOV. The simulation stops when the hiker agent reaches the target destination. The elevation raster file and the cost surface map are based on a 1 Arc-second (30m) resolution SRTM image, scaled down 5 times. Each patch represents a square of 150m, with an area of 0,0225km². The dataset uses a UTM Sirgas 2000 22S projection system. There are four different cost functions available to use. They change the cost surface used by the hikers to navigate around the world.
An agent-based model of school enrollment process under educational competition
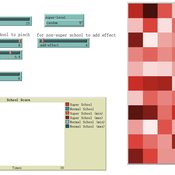
Yao Tong | Published Sunday, August 04, 2024Due to the role of education in promoting social status and facilitating upward social mobility, individuals and their families spare no effort to pursue better educational opportunities, especially in countries where education is highly competitive.
In China, the enrollment of senior high schools and universities mainly follows a ranking system based on students’ scores in national entrance exams (Zhongkao and Gaokao). Typically, students with higher scores have priority in choosing schools and endeavor to get into better senior high schools to increase their chances of entering a prestigious university.
However, students can only select “better” senior high schools based on their average Gaokao grades, which are strongly influenced by the initial performance (Zhongkao grades) of enrolled students. The true quality indicator of school education (schooling effect, defined as the grade improvement achieved through education at the senior high school) is unknowable. This raises the first question: will school rankings reflect the real educational quality of schools over decades of educational competition, or merely the initial quality of the students they enroll?
…
Eliminating hepatitis C virus as a public health threat among HIV-positive men who have sex with men
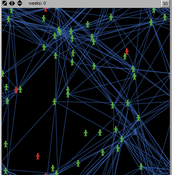
Nick Scott Mark Stoove David P Wilson Olivia Keiser Carol El-Hayek Joseph Doyle Margaret Hellard | Published Wednesday, October 12, 2016 | Last modified Sunday, December 16, 2018We compare three model estimates for the time and treatment requirements to eliminate HCV among HIV-positive MSM in Victoria, Australia: a compartmental model; an ABM parametrized by surveillance data; and an ABM with a more heterogeneous population.
Protein 2.0: An Agent-Based Model for Simulating Norway’s Protein Sector Under Carbon Pricing and the Emergence of Cultivated Proteins
Gary Polhill Nick Roxburgh Rob J.F. Burton Klaus Mittenzwei | Published Thursday, May 08, 2025Protein 2.0 is a systems model of the Norwegian protein sector designed to explore the potential impacts of carbon taxation and the emergence of cultivated meat and dairy technologies. The model simulates production, pricing, and consumption dynamics across conventional and cultivated protein sources, accounting for emissions intensity, technological learning, economies of scale, and agent behaviour. It assesses how carbon pricing could alter the competitiveness of conventional beef, lamb, pork, chicken, milk, and egg production relative to emerging cultivated alternatives, and evaluates the implications for domestic production, emissions, and food system resilience. The model provides a flexible platform for exploring policy scenarios and transition pathways in protein supply. Further details can be found in the associated publication.
Concession Forestry Modeling
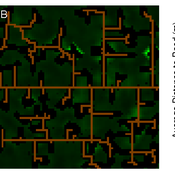
Andrew Bell Daniel G Brown Rick L Riolo Jacqueline M Doremus Thomas P Lyon John Vandermeer Arun Agrawal | Published Thursday, January 23, 2014A logging agent builds roads based on the location of high-value hotspots, and cuts trees based on road access. A forest monitor sanctions the logger on observed infractions, reshaping the pattern of road development.
Agent-based model of sexual partnership
Andrea Knittel | Published Monday, December 05, 2011 | Last modified Saturday, April 27, 2013In this model agents meet, evaluate one another, decide whether or not to date, if and when to become sexual partners, and when to break up.
LogoClim: WorldClim in NetLogo
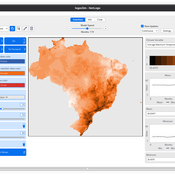
Daniel Vartanian Leandro Garcia Aline Martins de Carvalho Aline | Published Thursday, July 03, 2025 | Last modified Monday, July 13, 2026LogoClim is a NetLogo model designed to be integrated into other simulations through the LevelSpace extension (Hjorth et al., 2020), providing high resolution climate data from sources validated and used by the Intergovernmental Panel on Climate Change (IPCC).
The model simplifies and standardizes the integration of climate data into NetLogo, allowing researchers to focus their efforts on the model itself with the assurance of using reliable and widely recognized data. Although its main use is as a component of larger simulations, LogoClim also has its own graphical interface for monitoring and checking the datasets.
The climate data comes from the WorldClim 2.1 project (Fick & Hijmans, 2017), for which LogoClim works as an interface to NetLogo. The model supports all three WorldClim data series: (1) Historical Climate Data (1970 to 2000), with 12 monthly points for minimum, mean, and maximum temperature, precipitation, solar radiation, wind speed, vapor pressure, elevation, and bioclimatic variables; (2) Historical Monthly Weather Data (1951 to 2024), based on downscaling of CRU-TS-4.09, developed by the Climatic Research Unit at the University of East Anglia (Harris et al., 2020), with minimum and maximum temperature and total precipitation; and (3) Future Climate Data, based on downscaling climate projections derived from global climate models of the Coupled Model Intercomparison Project Phase 6 (CMIP6) (Eyring et al., 2016) for four future periods (2021 to 2040, 2041 to 2060, 2061 to 2080, and 2081 to 2100) and four scenarios based on the Shared Socioeconomic Pathways (SSPs 126, 245, 370, and 585), covering minimum and maximum temperature, total precipitation, and bioclimatic variables. All series are available at multiple spatial resolutions, from 10 minutes (about 340 km² at the equator) to 30 seconds (about 1 km² at the equator).
…
The various technologies used inside a Dutch greenhouse interact in combination with an external climate, resulting in an emergent internal climate, which contributes to the final productivity of the greenhouse. This model examines how differing technology development styles affects the overall ability of a community of growers to approach the theoretical maximum yield.
Displaying 10 of 43 results for "Nick Gotts" clear search