Our mission is to help computational modelers develop, document, and share their computational models in accordance with community standards and good open science and software engineering practices. Model authors can publish their model source code in the Computational Model Library with narrative documentation as well as metadata that supports open science and emerging norms that facilitate software citation, computational reproducibility / frictionless reuse, and interoperability. Model authors can also request private peer review of their computational models. Models that pass peer review receive a DOI once published.
All users of models published in the library must cite model authors when they use and benefit from their code.
Please check out our model publishing tutorial and feel free to contact us if you have any questions or concerns about publishing your model(s) in the Computational Model Library.
Displaying 10 of 1009 results for "J Van Der Beek" clear search
RiskNetABM
Birgit Müller Jürgen Groeneveld Karin Frank Meike Will Friederike Lenel | Published Monday, July 20, 2020 | Last modified Monday, May 03, 2021The fight against poverty is an urgent global challenge. Microinsurance is promoted as a valuable instrument for buffering income losses due to health or climate-related risks of low-income households in developing countries. However, apart from direct positive effects they can have unintended side effects when insured households lower their contribution to traditional arrangements where risk is shared through private monetary support.
RiskNetABM is an agent-based model that captures dynamics between income losses, insurance payments and informal risk-sharing. The model explicitly includes decisions about informal transfers. It can be used to assess the impact of insurance products and informal risk-sharing arrangements on the resilience of smallholders. Specifically, it allows to analyze whether and how economic needs (i.e. level of living costs) and characteristics of extreme events (i.e. frequency, intensity and type of shock) influence the ability of insurance and informal risk-sharing to buffer income shocks. Two types of behavior with regard to private monetary transfers are explicitly distinguished: (1) all households provide transfers whenever they can afford it and (2) insured households do not show solidarity with their uninsured peers.
The model is stylized and is not used to analyze a particular case study, but represents conditions from several regions with different risk contexts where informal risk-sharing networks between smallholder farmers are prevalent.
…
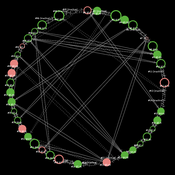
Peer reviewed ArchMatNet: Archaeological Material Networks
Claudine Gravel-Miguel Robert Bischoff Cecilia Padilla-Iglesias | Published Monday, February 20, 2023The purpose of the model is to investigate how different factors affect the ability of researchers to reconstruct prehistoric social networks from artifact stylistic similarities, as well as the overall diversity of cultural traits observed in archaeological assemblages. Given that cultural transmission and evolution is affected by multiple interacting phenomena, our model allows to simultaneously explore six sets of factors that may condition how social networks relate to shared culture between individuals and groups:
- Factors relating to the structure of social groups
- Factors relating to the cultural traits in question
- Factors relating to individual learning strategies
- Factors relating to the environment
…
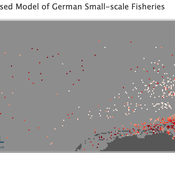
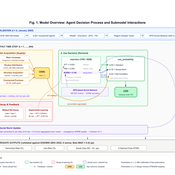
Peer reviewed Viable North Sea (ViNoS): A NetLogo Agent-based Model of German Small-scale Fisheries
Wolfgang Nikolaus Probst Jieun Seo Jürgen Scheffran Carsten Lemmen Sascha Hokamp Verena Mühlberger Serra Örey | Published Thursday, May 25, 2023 | Last modified Tuesday, December 05, 2023Viable North Sea (ViNoS) is an Agent-based Model of the German North Sea Small-scale Fisheries in a Social-Ecological Systems framework focussing on the adaptive behaviour of fishers facing regulatory, economic, and resource changes. Small-scale fisheries are an important part both of the cultural perception of the German North Sea coast and of its fishing industry. These fisheries are typically family-run operations that use smaller boats and traditional fishing methods to catch a variety of bottom-dwelling species, including plaice, sole, and brown shrimp. Fisheries in the North Sea face area competition with other uses of the sea – long practiced ones like shipping, gas exploration and sand extractions, and currently increasing ones like marine protection and offshore wind farming. German authorities have just released a new maritime spatial plan implementing the need for 30% of protection areas demanded by the United Nations High Seas Treaty and aiming at up to 70 GW of offshore wind power generation by 2045. Fisheries in the North Sea also have to adjust to the northward migration of their established resources following the climate heating of the water. And they have to re-evaluate their economic balance by figuring in the foreseeable rise in oil price and the need for re-investing into their aged fleet.
Peer reviewed Kenya ITN Agent-Based Microsimulation (2003–2024)
Wooyoung Kim Hosang Shin | Published Saturday, April 18, 2026 | Last modified Tuesday, June 16, 2026An agent-based microsimulation of insecticide-treated net (ITN) distribution and adoption in Kenya (2003–2024), integrating the Theory of Planned Behaviour, Rogers diffusion, Weibull net decay, and a GPS-based two-layer social network. 8,561 household agents calibrated via Approximate Bayesian Computation to six DHS/MIS survey waves, achieving 2.42 pp mean absolute error on Kenya-level ownership. The analysis chain supports mechanism counterfactuals and policy experiments on equity outcomes of ITN distribution strategies.
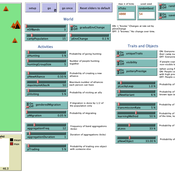
Introducing two extensions of Schelling's segregation model
Andreas Flache Carlos A. de Matos Fernandes | Published Monday, January 25, 2021Schelling famously proposed an extremely simple but highly illustrative social mechanism to understand how strong ethnic segregation could arise in a world where individuals do not necessarily want it. Schelling’s simple computational model is the starting point for our extensions in which we build upon Wilensky’s original NetLogo implementation of this model. Our two NetLogo models can be best studied while reading our chapter “Agent-based Computational Models” (Flache and de Matos Fernandes, 2021). In the chapter, we propose 10 best practices to elucidate how agent-based models are a unique method for providing and analyzing formally precise, and empirically plausible mechanistic explanations of puzzling social phenomena, such as segregation, in the social world. Our chapter addresses in particular analytical sociologists who are new to ABMs.
In the first model (SegregationExtended), we build on Wilensky’s implementation of Schelling’s model which is available in NetLogo library (Wilensky, 1997). We considerably extend this model, allowing in particular to include larger neighborhoods and a population with four groups roughly resembling the ethnic composition of a contemporary large U.S. city. Further features added concern the possibility to include random noise, and the addition of a number of new outcome measures tuned to highlight macro-level implications of the segregation dynamics for different groups in the agent society.
In SegregationDiscreteChoice, we further modify the model incorporating in particular three new features: 1) heterogeneous preferences roughly based on empirical research categorizing agents into low, medium, and highly tolerant within each of the ethnic subgroups of the population, 2) we drop global thresholds (%-similar-wanted) and introduce instead a continuous individual-level single-peaked preference function for agents’ ideal neighborhood composition, and 3) we use a discrete choice model according to which agents probabilistically decide whether to move to a vacant spot or stay in the current spot by comparing the attractiveness of both locations based on the individual preference functions.
…
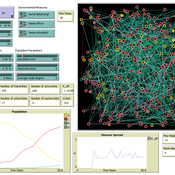
The Effect of Different Governmental Pandemic Control Measures on the Spread of a Virus Disease
Chiara Letter | Published Wednesday, January 26, 2022In this model, the spread of a virus disease in a network consisting of school pupils, employed, and umemployed people is simulated. The special feature in this model is the distinction between different types of links: family-, friends-, school-, or work-links. In this way, different governmental measures can be implemented in order to decelerate or stop the transmission.
A simple Multi-Agent System of the Tragedy Of the Commons (MASTOC-s)
Julia Schindler | Published Friday, June 29, 2012 | Last modified Saturday, April 27, 2013This is a simple model replicating Hardin’s Tragedy of the Commons using reactive agents that have psychological behavioral and social preferences.
Software for an agent-based game-theoretic model of the contact hypothesis of prejudice reduction, to accompany “Modeling Prejudice Reduction,” in the Handbook of Computational Social Psychology, adapted from Public Affairs Quarterly 19 (2) 2005.
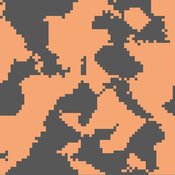
Exploring Transitions towards Sustainable Construction
Jesus Rosales-Carreon César García-Díaz | Published Wednesday, October 30, 2013 | Last modified Saturday, January 31, 2015This model illustrates actor interaction in the construction sector, according to information gathered in NL. It offers a simple frame to represent diverse interests, interdependencies and effects on the number of built sustainable houses.
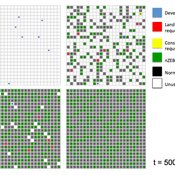
Collective Decision Making for Ecological Restoration version 2.0
Dean Massey Moira Zellner Cristy Watkins Jeremy Brooks Kristen Ross Lynne M Westphal | Published Wednesday, November 19, 2014CoDMER v. 2.0 was parameterized with ethnographic data from organizations dealing with prescribed fire and seeding native plants, to advance theory on how collective decisions emerge in ecological restoration.
Displaying 10 of 1009 results for "J Van Der Beek" clear search