Our mission is to help computational modelers develop, document, and share their computational models in accordance with community standards and good open science and software engineering practices. Model authors can publish their model source code in the Computational Model Library with narrative documentation as well as metadata that supports open science and emerging norms that facilitate software citation, computational reproducibility / frictionless reuse, and interoperability. Model authors can also request private peer review of their computational models. Models that pass peer review receive a DOI once published.
All users of models published in the library must cite model authors when they use and benefit from their code.
Please check out our model publishing tutorial and feel free to contact us if you have any questions or concerns about publishing your model(s) in the Computational Model Library.
Displaying 10 of 364 results for "Miriam C. Kopels" clear search
Peer reviewed SIM-VOLATILE: Adoption of emerging circular technologies in the waste-treatment sector
Siavash Farahbakhsh | Published Wednesday, December 14, 2022The SIM-VOLATILE model is a technology adoption model at the population level. The technology, in this model, is called Volatile Fatty Acid Platform (VFAP) and it is in the frame of the circular economy. The technology is considered an emerging technology and it is in the optimization phase. Through the adoption of VFAP, waste-treatment plants will be able to convert organic waste into high-end products rather than focusing on the production of biogas. Moreover, there are three adoption/investment scenarios as the technology enables the production of polyhydroxyalkanoates (PHA), single-cell oils (SCO), and polyunsaturated fatty acids (PUFA). However, due to differences in the processing related to the products, waste-treatment plants need to choose one adoption scenario.
In this simulation, there are several parameters and variables. Agents are heterogeneous waste-treatment plants that face the problem of circular economy technology adoption. Since the technology is emerging, the adoption decision is associated with high risks. In this regard, first, agents evaluate the economic feasibility of the emerging technology for each product (investment scenarios). Second, they will check on the trend of adoption in their social environment (i.e. local pressure for each scenario). Third, they combine these two economic and social assessments with an environmental assessment which is their environmental decision-value (i.e. their status on green technology). This combination gives the agent an overall adaptability fitness value (detailed for each scenario). If this value is above a certain threshold, agents may decide to adopt the emerging technology, which is ultimately depending on their predominant adoption probabilities and market gaps.
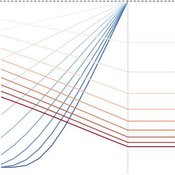
The various technologies used inside a Dutch greenhouse interact in combination with an external climate, resulting in an emergent internal climate, which contributes to the final productivity of the greenhouse. This model examines how differing technology development styles affects the overall ability of a community of growers to approach the theoretical maximum yield.
Learning Extension - RAGE RAngeland Grazing Model
Nikita Strelkovskii Cristina I. Apetrei Nikolay Khabarov Valeria Javalera Rincón | Published Saturday, July 22, 2023This is an extension of the original RAGE model (Dressler et al. 2018), where we add learning capabilities to agents, specifically learning-by-doing and social learning (two processes central to adaptive (co-)management).
The extension module is applied to smallholder farmers’ decision-making - here, a pasture (patch) is the private property of the household (agent) placed on it and there is no movement of the households. Households observe the state of the pasture and their neighrbours to make decisions on how many livestock to place on their pasture every year. Three new behavioural types are created (which cannot be combined with the original ones): E-RO (baseline behaviour), E-LBD (learning-by-doing) and E-RO-SL1 (social learning). Similarly to the original model, these three types can be compared regarding long-term social-ecological performance. In addition, a global strategy switching option (corresponding to double-loop learning) allows users to study how behavioural strategies diffuse in a heterogeneous population of learning and non-learning agents.
An important modification of the original model is that extension agents are heterogeneous in how they deal with uncertainty. This is represented by an agent property, called the r-parameter (household-risk-att in the code). The r-parameter is catch-all for various factors that form an agent’s disposition to act in a certain way, such as: uncertainty in the sensing (partial observability of the resource system), noise in the information received, or an inherent characteristic of the agent, for instance, their risk attitude.
Open Peer Review Model
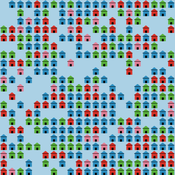
Federico Bianchi | Published Monday, May 24, 2021This is an agent-based model of a population of scientists alternatively authoring or reviewing manuscripts submitted to a scholarly journal for peer review. Peer-review evaluation can be either ‘confidential’, i.e. the identity of authors and reviewers is not disclosed, or ‘open’, i.e. authors’ identity is disclosed to reviewers. The quality of the submitted manuscripts vary according to their authors’ resources, which vary according to the number of publications. Reviewers can assess the assigned manuscript’s quality either reliably of unreliably according to varying behavioural assumptions, i.e. direct/indirect reciprocation of past outcome as authors, or deference towards higher-status authors.
Peer reviewed Price Evolution with Expectations
J M Applegate Gesine Steudel Armin Haas Carlo Jaeger | Published Friday, September 10, 2021The Price Evolution with Expectations model provides the opportunity to explore the question of non-equilibrium market dynamics, and how and under which conditions an economic system converges to the classically defined economic equilibrium. To accomplish this, we bring together two points of view of the economy; the classical perspective of general equilibrium theory and an evolutionary perspective, in which the current development of the economic system determines the possibilities for further evolution.
The Price Evolution with Expectations model consists of a representative firm producing no profit but producing a single good, which we call sugar, and a representative household which provides labour to the firm and purchases sugar.The model explores the evolutionary dynamics whereby the firm does not initially know the household demand but eventually this demand and thus the correct price for sugar given the household’s optimal labour.
The model can be run in one of two ways; the first does not include money and the second uses money such that the firm and/or the household have an endowment that can be spent or saved. In either case, the household has preferences for leisure and consumption and a demand function relating sugar and price, and the firm has a production function and learns the household demand over a set number of time steps using either an endogenous or exogenous learning algorithm. The resulting equilibria, or fixed points of the system, may or may not match the classical economic equilibrium.
Peer reviewed General Housing Model
J M Applegate | Published Thursday, May 07, 2020The General Housing Model demonstrates a basic housing market with bank lending, renters, owners and landlords. This model was developed as a base to which students contributed additional functions during Arizona State University’s 2020 Winter School: Agent-Based Modeling of Social-Ecological Systems.
MCA-SdA (ABM of mining-community-aquifer interactions in Salar de Atacama, Chile)
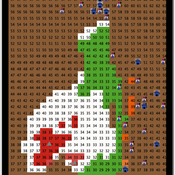
Wenjuan Liu | Published Tuesday, December 01, 2020 | Last modified Thursday, November 04, 2021This model represnts an unique human-aquifer interactions model for the Li-extraction in Salar de Atacama, Chile. It describes the local actors’ experience of mining-induced changes in the socio-ecological system, especially on groundwater changes and social stressors. Social interactions are designed specifically according to a long-term local fieldwork by Babidge et al. (2019, 2020). The groundwater system builds on the FlowLogo model by Castilla-Rho et al. (2015), which was then parameterized and calibrated with local hydrogeological inputs in Salar de Atacama, Chile. The social system of the ABM is defined and customozied based on empirical studies to reflect three major stressors: drought stress, population stress, and mining stress. The model reports evolution of groundwater changes and associated social stress dynamics within the modeled time frame.
MiniDemographicABM.jl: A simplified agent-based demographic model of the UK
Atiyah Elsheikh | Published Friday, July 28, 2023 | Last modified Tuesday, December 12, 2023This package implements a simplified artificial agent-based demographic model of the UK. Individuals of an initial population are subject to ageing, deaths, births, divorces and marriages. A specific case-study simulation is progressed with a user-defined simulation fixed step size on a hourly, daily, weekly, monthly basis or even an arbitrary user-defined clock rate. While the model can serve as a base model to be adjusted to realistic large-scale socio-economics, pandemics or social interactions-based studies mainly within a demographic context, the main purpose of the model is to explore and exploit capabilities of the state-of-the-art Agents.jl Julia package as well as other ecosystem of Julia packages like GlobalSensitivity.jl. Code includes examples for evaluating global sensitivity analysis using Morris and Sobol methods and local sensitivity analysis using OFAT and OAT methods. Multi-threaded parallelization is enabled for improved runtime performance.
TechNet_04: Cultural Transmission in a Spatially-Situated Network
Andrew White | Published Monday, October 08, 2012 | Last modified Saturday, April 27, 2013The TechNet_04 is an abstract model that embeds a simple cultural tranmission process in an environment where interaction is structured by spatially-situated networks.
ABM for Underwater optical wireless communication in a water tank
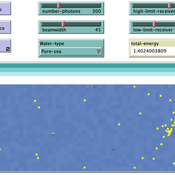
Mohamed ABID | Published Sunday, May 29, 2022This model simulates the propagation of photons in a water tank. A source of light emits an impulse of photons with equal energy represented by yellow dots. These photons are then scattered by water particles before possibly reaching the photo-detector represented by a gray line. Different types of water are considered. For each one of them we calculate the total received energy.
The water tank is represented by a blue rectangle with fixed dimensions. It’s exposed to the air interface and has totally absorbent barriers. Four types of water are supported. Each one is characterized by its absorption and scattering coefficients.
At the source, the photons are generated uniformly with a random direction within the beamwidth. Each photon travels a random distance drawn from a distribution depending on the water characteristics before encountering a water particle.
Based on the updated position of the photon, three situations may occur:
-The photon hits the barrier of the tank on its trajectory. In this case it’s considered as lost since the barriers are assumed totally absorbent.
…
Displaying 10 of 364 results for "Miriam C. Kopels" clear search