Our mission is to help computational modelers develop, document, and share their computational models in accordance with community standards and good open science and software engineering practices. Model authors can publish their model source code in the Computational Model Library with narrative documentation as well as metadata that supports open science and emerging norms that facilitate software citation, computational reproducibility / frictionless reuse, and interoperability. Model authors can also request private peer review of their computational models. Models that pass peer review receive a DOI once published.
All users of models published in the library must cite model authors when they use and benefit from their code.
Please check out our model publishing tutorial and feel free to contact us if you have any questions or concerns about publishing your model(s) in the Computational Model Library.
Displaying 10 of 304 results for "Aaron C Fisher" clear search
Peer reviewed Visibility of archaeological social networks
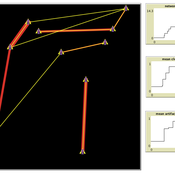
Claudine Gravel-Miguel | Published Sunday, November 26, 2023The purpose of this model is to explore the impact of combining archaeological palimpsests with different methods of cultural transmission on the visibility of prehistoric social networks. Up until recently, Paleolithic archaeologists have relied on stylistic similarities of artifacts to reconstruct social networks. However, this method - which is successfully applied to more recent ceramic assemblages - may not be applicable to Paleolithic assemblages, as several of those consist of palimpsests of occupations. Therefore, this model was created to study how palimpsests of occupation affect our social network reconstructions.
The model simplifies inter-groups interactions between populations who share cultural traits as they produce artifacts. It creates a proxy archaeological record of artifacts with stylistic traits that can then be used to reconstruct interactions. One can thus use this model to compare the networks reconstructed through stylistic similarities with direct contact.
HMODEL: an exploratory simulation of surface archaeological formation
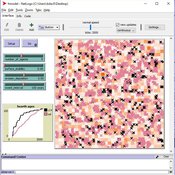
Benjamin Davies Simon Holdaway Patricia Fanning | Published Thursday, November 30, 2017This model is used to simulate the influence of spatially and temporally variable sedimentary processes on the distribution of dated archaeological features in a surface context.
Peer reviewed The Indus Village's Weather model: procedural generation of daily weather
Andreas Angourakis | Published Tuesday, May 13, 2025Overview
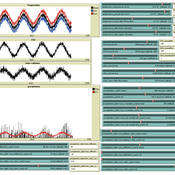
The Weather model is a procedural generation model designed to create realistic daily weather data for socioecological simulations. It generates synthetic weather time series for solar radiation, temperature, and precipitation using algorithms based on sinusoidal and double logistic functions. The model incorporates stochastic variation to mimic unpredictable weather patterns and aims to provide realistic yet flexible weather inputs for exploring diverse climate scenarios.
The Weather model can be used independently or integrated into larger models, providing realistic weather patterns without extensive coding or data collection. It can be customized to meet specific requirements, enabling users to gain a better understanding of the underlying mechanisms and have greater confidence in their applications.
…
Agent-based model of sexual partnership
Andrea Knittel | Published Monday, December 05, 2011 | Last modified Saturday, April 27, 2013In this model agents meet, evaluate one another, decide whether or not to date, if and when to become sexual partners, and when to break up.
SimPLS - The PLS Agent
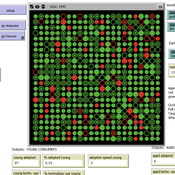
Iris Lorscheid Sandra Schubring Matthias Meyer Christian Ringle | Published Monday, April 18, 2016 | Last modified Tuesday, May 17, 2016The simulation model SimPLS shows an application of the PLS agent concept, using SEM as empirical basis for the definition of agent architectures. The simulation model implements the PLS path model TAM about the decision of using innovative products.
Peer reviewed Infectious diseases model for mixed-methods research chapter
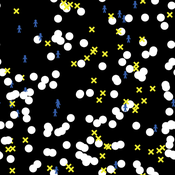
Mark Moritz Ian M Hamilton Chelsea E Hunter Daniel C Peart | Published Sunday, January 30, 2022The purpose of this curricular model is to teach students the basics of modeling complex systems using agent-based modeling. It is a simple SIR model that simulates how a disease spreads through a population as its members change from susceptible to infected to recovered and then back to susceptible. The dynamics of the model are such that there are multiple emergent outcomes depending on the parameter settings, initial conditions, and chance.
The curricular model can be used with the chapter Agent-Based Modeling in Mixed Methods Research (Moritz et al. 2022) in the Handbook of Teaching Qualitative & Mixed Methods (Ruth et al. 2022).
The instructional videos can be accessed on YouTube: Video 1 (https://youtu.be/32_JIfBodWs); Video 2 (https://youtu.be/0PK_zVKNcp8); and Video 3 (https://youtu.be/0bT0_mYSAJ8).
LogoClim: WorldClim in NetLogo
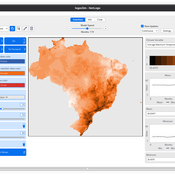
Daniel Vartanian Leandro Garcia Aline Martins de Carvalho Aline | Published Thursday, July 03, 2025 | Last modified Monday, July 13, 2026LogoClim is a NetLogo model designed to be integrated into other simulations through the LevelSpace extension (Hjorth et al., 2020), providing high resolution climate data from sources validated and used by the Intergovernmental Panel on Climate Change (IPCC).
The model simplifies and standardizes the integration of climate data into NetLogo, allowing researchers to focus their efforts on the model itself with the assurance of using reliable and widely recognized data. Although its main use is as a component of larger simulations, LogoClim also has its own graphical interface for monitoring and checking the datasets.
The climate data comes from the WorldClim 2.1 project (Fick & Hijmans, 2017), for which LogoClim works as an interface to NetLogo. The model supports all three WorldClim data series: (1) Historical Climate Data (1970 to 2000), with 12 monthly points for minimum, mean, and maximum temperature, precipitation, solar radiation, wind speed, vapor pressure, elevation, and bioclimatic variables; (2) Historical Monthly Weather Data (1951 to 2024), based on downscaling of CRU-TS-4.09, developed by the Climatic Research Unit at the University of East Anglia (Harris et al., 2020), with minimum and maximum temperature and total precipitation; and (3) Future Climate Data, based on downscaling climate projections derived from global climate models of the Coupled Model Intercomparison Project Phase 6 (CMIP6) (Eyring et al., 2016) for four future periods (2021 to 2040, 2041 to 2060, 2061 to 2080, and 2081 to 2100) and four scenarios based on the Shared Socioeconomic Pathways (SSPs 126, 245, 370, and 585), covering minimum and maximum temperature, total precipitation, and bioclimatic variables. All series are available at multiple spatial resolutions, from 10 minutes (about 340 km² at the equator) to 30 seconds (about 1 km² at the equator).
…
Logônia: Plant Growth Response Model in NetLogo
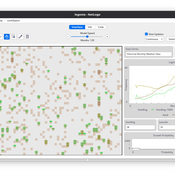
Daniel Vartanian Leandro Garcia Aline | Published Saturday, September 13, 2025 | Last modified Monday, July 13, 2026Logônia is a NetLogo model that simulates the growth response of a fictional plant, Logônia, under different climatic conditions. The model uses climate data from WorldClim 2.1 (Fick & Hijmans, 2017) and demonstrates how to integrate the LogoClim model through the LevelSpace extension.
The model was developed according to the FAIR principles for research software (Barker et al., 2022) and is openly available on the CoMSES Network and GitHub.
Model of communication between two groups of managers in the course of project implementation
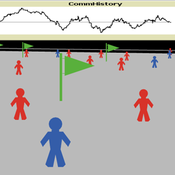
Smarzhevskiy Ivan | Published Monday, December 07, 2020This is a simulation model of communication between two groups of managers in the course of project implementation. The “world” of the model is a space of interaction between project participants, each of which belongs either to a group of work performers or to a group of customers. Information about the progress of the project is publicly available and represents the deviation Earned value (EV) from the planned project value (cost baseline).
The key elements of the model are 1) persons belonging to a group of customers or performers, 2) agents that are communication acts. The life cycle of persons is equal to the time of the simulation experiment, the life cycle of the communication act is 3 periods of model time (for the convenience of visualizing behavior during the experiment). The communication act occurs at a specific point in the model space, the coordinates of which are realized as random variables. During the experiment, persons randomly move in the model space. The communication act involves persons belonging to a group of customers and a group of performers, remote from the place of the communication act at a distance not exceeding the value of the communication radius (MaxCommRadius), while at least one representative from each of the groups must participate in the communication act. If none are found, the communication act is not carried out. The number of potential communication acts per unit of model time is a parameter of the model (CommPerTick).
The managerial sense of the feedback is the stimulating effect of the positive value of the accumulated communication complexity (positive background of the project implementation) on the productivity of the performers. Provided there is favorable communication (“trust”, “mutual understanding”) between the customer and the contractor, it is more likely that project operations will be performed with less lag behind the plan or ahead of it.
The behavior of agents in the world of the model (change of coordinates, visualization of agents’ belonging to a specific communicative act at a given time, etc.) is not informative. Content data are obtained in the form of time series of accumulated communicative complexity, the deviation of the earned value from the planned value, average indicators characterizing communication - the total number of communicative acts and the average number of their participants, etc. These data are displayed on graphs during the simulation experiment.
The control elements of the model allow seven independent values to be varied, which, even with a minimum number of varied values (three: minimum, maximum, optimum), gives 3^7 = 2187 different variants of initial conditions. In this case, the statistical processing of the results requires repeated calculation of the model indicators for each grid node. Thus, the set of varied parameters and the range of their variation is determined by the logic of a particular study and represents a significant narrowing of the full set of initial conditions for which the model allows simulation experiments.
…
PopComp
Andre Costopoulos | Published Thursday, December 10, 2020PopComp by Andre Costopoulos 2020
andre.costopoulos@ualberta.ca
Licence: DWYWWI (Do whatever you want with it)
I use Netlogo to build a simple environmental change and population expansion and diffusion model. Patches have a carrying capacity and can host two kinds of populations (APop and BPop). Each time step, the carrying capacity of each patch has a given probability of increasing or decreasing up to a maximum proportion.
…
Displaying 10 of 304 results for "Aaron C Fisher" clear search