Our mission is to help computational modelers develop, document, and share their computational models in accordance with community standards and good open science and software engineering practices. Model authors can publish their model source code in the Computational Model Library with narrative documentation as well as metadata that supports open science and emerging norms that facilitate software citation, computational reproducibility / frictionless reuse, and interoperability. Model authors can also request private peer review of their computational models. Models that pass peer review receive a DOI once published.
All users of models published in the library must cite model authors when they use and benefit from their code.
Please check out our model publishing tutorial and feel free to contact us if you have any questions or concerns about publishing your model(s) in the Computational Model Library.
Displaying 10 of 280 results for "Hans-Hermann Thulke" clear search
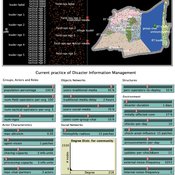
Peer reviewed Share: bottom-up disaster information management
Vittorio Nespeca Tina Comes Frances Brazier | Published Monday, December 05, 2022This model is intended to study the way information is collectively managed (i.e. shared, collected, processed, and stored) in a system and how it performs during a crisis or disaster. Performance is assessed in terms of the system’s ability to provide the information needed to the actors who need it when they need it. There are two main types of actors in the simulation, namely communities and professional responders. Their ability to exchange information is crucial to improve the system’s performance as each of them has direct access to only part of the information they need.
In a nutshell, the following occurs during a simulation. Due to a disaster, a series of randomly occurring disruptive events takes place. The actors in the simulation need to keep track of such events. Specifically, each event generates information needs for the different actors, which increases the information gaps (i.e. the “piles” of unaddressed information needs). In order to reduce the information gaps, the actors need to “discover” the pieces of information they need. The desired behavior or performance of the system is to keep the information gaps as low as possible, which is to address as many information needs as possible as they occur.
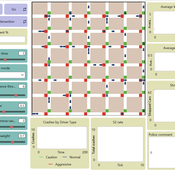
Amber Dilemma Zone: Driver Cognition and Signal Control in Urban Traffic
Mansoor Abdul Bari | Published Sunday, July 19, 2026This model is an extension of Wilensky’s (2003) Traffic Grid, a foundational NetLogo model of urban traffic flow. It embeds a dual-process cognitive architecture into each driver agent, transforming the original’s identical reactive units into cognitively heterogeneous individuals whose internal mental state evolves with experience; making the same intersection produce different decisions from different drivers, and different decisions from the same driver across occasions.
The core question the model addresses is the yellow-light dilemma zone: the seconds following amber onset in which a driver can neither stop safely nor clear the intersection before red. Field research documents that behavioral variance at this moment cannot be explained by geometry or legal obligation alone. This model provides the cognitive architecture that has been missing from traffic ABMs.
Each driver routes every amber-onset decision through either System 1 (fast, heuristic, automatic) or System 2 (slow, deliberative, prospect-theoretic), switching dynamically based on cognitive load, accumulated near-miss memory, and situational framing. The result is crash outcomes that are attributable, path-dependent, and sensitive to both driver disposition and signal infrastructure; none of which fixed-rule models can reproduce. Three signal control modes are included: fixed-cycle (replicating Wilensky’s original), adaptive-queue, and smart occupancy-based switching.
Peer reviewed Labor and environment in global value chains: An evolutionary policy study with a three-sector and two-region agent-based macroeconomic model
Lena Gerdes Manuel Scholz-Wäckerle Bernhard Rengs | Published Wednesday, December 22, 2021With this model, we investigate resource extraction and labor conditions in the Global South as well as implications for climate change originating from industry emissions in the North. The model serves as a testbed for simulation experiments with evolutionary political economic policies addressing these issues. In the model, heterogeneous agents interact in a self-organizing and endogenously developing economy. The economy contains two distinct regions – an abstract Global South and Global North. There are three interlinked sectors, the consumption good–, capital good–, and resource production sector. Each region contains an independent consumption good sector, with domestic demand for final goods. They produce a fictitious consumption good basket, and sell it to the households in the respective region. The other sectors are only present in one region. The capital good sector is only found in the Global North, meaning capital goods (i.e. machines) are exclusively produced there, but are traded to the foreign as well as the domestic market as an intermediary. For the production of machines, the capital good firms need labor, machines themselves and resources. The resource production sector, on the other hand, is only located in the Global South. Mines extract resources and export them to the capital firms in the North. For the extraction of resources, the mines need labor and machines. In all three sectors, prices, wages, number of workers and physical capital of the firms develop independently throughout the simulation. To test policies, an international institution is introduced sanctioning the polluting extractivist sector in the Global South as well as the emitting industrial capital good producers in the North with the aim of subsidizing innovation reducing environmental and social impacts.
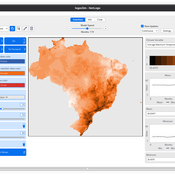
LogoClim: WorldClim in NetLogo
Daniel Vartanian Leandro Garcia Aline Martins de Carvalho Aline | Published Thursday, July 03, 2025 | Last modified Monday, July 13, 2026LogoClim is a NetLogo model designed to be integrated into other simulations through the LevelSpace extension (Hjorth et al., 2020), providing high resolution climate data from sources validated and used by the Intergovernmental Panel on Climate Change (IPCC).
The model simplifies and standardizes the integration of climate data into NetLogo, allowing researchers to focus their efforts on the model itself with the assurance of using reliable and widely recognized data. Although its main use is as a component of larger simulations, LogoClim also has its own graphical interface for monitoring and checking the datasets.
The climate data comes from the WorldClim 2.1 project (Fick & Hijmans, 2017), for which LogoClim works as an interface to NetLogo. The model supports all three WorldClim data series: (1) Historical Climate Data (1970 to 2000), with 12 monthly points for minimum, mean, and maximum temperature, precipitation, solar radiation, wind speed, vapor pressure, elevation, and bioclimatic variables; (2) Historical Monthly Weather Data (1951 to 2024), based on downscaling of CRU-TS-4.09, developed by the Climatic Research Unit at the University of East Anglia (Harris et al., 2020), with minimum and maximum temperature and total precipitation; and (3) Future Climate Data, based on downscaling climate projections derived from global climate models of the Coupled Model Intercomparison Project Phase 6 (CMIP6) (Eyring et al., 2016) for four future periods (2021 to 2040, 2041 to 2060, 2061 to 2080, and 2081 to 2100) and four scenarios based on the Shared Socioeconomic Pathways (SSPs 126, 245, 370, and 585), covering minimum and maximum temperature, total precipitation, and bioclimatic variables. All series are available at multiple spatial resolutions, from 10 minutes (about 340 km² at the equator) to 30 seconds (about 1 km² at the equator).
…
Model to assess factors that influence local communities compliance with protected areas policies
Gustavo Andrade | Published Monday, November 21, 2011 | Last modified Saturday, April 27, 2013We built a model using R,polr package, to assess 55 published case studies from developing countries to determine what factors influence the level of compliance of local communities with protected area regulations.
Interactions between organizations and social networks in common-pool resource governance
Phesi Project | Published Monday, October 29, 2012 | Last modified Saturday, April 27, 2013Explores how social networks affect implementation of institutional rules in a common pool resource.
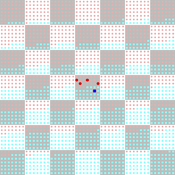
Adoption as a social marker
Paul Smaldino | Published Monday, October 17, 2016A model of innovation diffusion in a structured population with two groups who are averse to adopting a produce popular with the outgroup.
Peer reviewed Simulating the Economic Impact of Boko Haram on a Cameroonian Floodplain
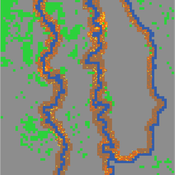
Mark Moritz Nathaniel Henry Sarah Laborde | Published Saturday, October 22, 2016 | Last modified Wednesday, June 07, 2017This model examines the potential impact of market collapse on the economy and demography of fishing households in the Logone Floodplain, Cameroon.
Agent-Based Simulation for International Tax Compliance
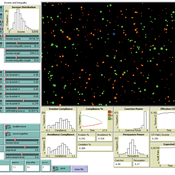
Peter Gerbrands | Published Tuesday, July 18, 2023Country-by-Country Reporting and Automatic Exchange of Information have recently been implemented in European Union (EU) countries. These international tax reforms increase tax compliance in the short term. In the long run, however, taxpayers will continue looking abroad to avoid taxation and, countries, looking for additional revenues, will provide opportunities. As a result, tax competition intensifies and the initial increase in compliance could reverse. To avoid international tax reforms being counteracted by tax competition, this paper suggests bilateral responsive regulation to maximize compliance. This implies that countries would use different tax policy instruments toward other countries, including tax and secrecy havens.
To assess the effectiveness of fully or partially enforce tax policies, this agent based model has been ran many times under different enforcement rules, which influence the perceived enforced- and voluntary compliance, as the slippery-slope model prescribes. Based on the dynamics of this perception and the extent to which agents influence each other, the annual amounts of tax evasion, tax avoidance and taxes paid are calculated over longer periods of time.
The agent-based simulation finds that a differentiated policy response could increase tax compliance by 6.54 percent, which translates into an annual increase of €105 billion in EU tax revenues on income, profits, and capital gains. Corporate income tax revenues in France, Spain, and the UK alone would already account for €35 billion.
Income and Expenditure
Tony Lawson | Published Thursday, October 06, 2011 | Last modified Saturday, April 27, 2013How do households alter their spending patterns when they experience changes in income? This model answers this question using a random assignment scheme where spending patterns are copied from a household in the new income bracket.
Displaying 10 of 280 results for "Hans-Hermann Thulke" clear search