About the CoMSES Model Library more info
Our mission is to help computational modelers develop, document, and share their computational models in accordance with community standards and good open science and software engineering practices. Model authors can publish their model source code in the Computational Model Library with narrative documentation as well as metadata that supports open science and emerging norms that facilitate software citation, computational reproducibility / frictionless reuse, and interoperability. Model authors can also request private peer review of their computational models. Models that pass peer review receive a DOI once published.
All users of models published in the library must cite model authors when they use and benefit from their code.
Please check out our model publishing tutorial and feel free to contact us if you have any questions or concerns about publishing your model(s) in the Computational Model Library.
We also maintain a curated database of over 7500 publications of agent-based and individual based models with detailed metadata on availability of code and bibliometric information on the landscape of ABM/IBM publications that we welcome you to explore.
Displaying 10 of 233 results for "Paulien Herder" clear search
Peer reviewed Gregarious Behavior, Human Colonization and Social Differentiation Agent-Based Model
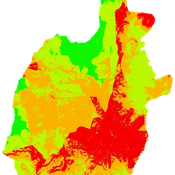
Gert Jan Hofstede Mark R Kramer Sebastian Fajardo Andrés Bernal Martijn de Vries | Published Thursday, August 20, 2020 | Last modified Thursday, October 29, 2020Studies of colonization processes in past human societies often use a standard population model in which population is represented as a single quantity. Real populations in these processes, however, are structured with internal classes or stages, and classes are sometimes created based on social differentiation. In this present work, information about the colonization of old Providence Island was used to create an agent-based model of the colonization process in a heterogeneous environment for a population with social differentiation. Agents were socially divided into two classes and modeled with dissimilar spatial clustering preferences. The model and simulations assessed the importance of gregarious behavior for colonization processes conducted in heterogeneous environments by socially-differentiated populations. Results suggest that in these conditions, the colonization process starts with an agent cluster in the largest and most suitable area. The spatial distribution of agents maintained a tendency toward randomness as simulation time increased, even when gregariousness values increased. The most conspicuous effects in agent clustering were produced by the initial conditions and behavioral adaptations that increased the agent capacity to access more resources and the likelihood of gregariousness. The approach presented here could be used to analyze past human colonization events or support long-term conceptual design of future human colonization processes with small social formations into unfamiliar and uninhabited environments.
Peer reviewed Descriptive Norm and Fraud Dynamics
Alexandra Eckert Matthias Meyer Christian Stindt | Published Tuesday, January 07, 2025The “Descriptive Norm and Fraud Dynamics” model demonstrates how fraudulent behavior can either proliferate or be contained within non-hierarchical organizations, such as peer networks, through social influence taking the form of a descriptive norm. This model expands on the fraud triangle theory, which posits that an individual must concurrently possess a financial motive, perceive an opportunity, and hold a pro-fraud attitude to engage in fraudulent activities (red agent). In the absence of any of these elements, the individual will act honestly (green agent).
The model explores variations in a descriptive norm mechanism, ranging from local distorted knowledge to global perfect knowledge. In the case of local distorted knowledge, agents primarily rely on information from their first-degree colleagues. This knowledge is often distorted because agents are slow to update their empirical expectations, which are only partially revised after one-to-one interactions. On the other end of the spectrum, local perfect knowledge is achieved by incorporating a secondary source of information into the agents’ decision-making process. Here, accurate information provided by an observer is used to update empirical expectations.
The model shows that the same variation of the descriptive norm mechanism could lead to varying aggregate fraud levels across different fraud categories. Two empirically measured norm sensitivity distributions associated with different fraud categories can be selected into the model to see the different aggregate outcomes.
Peer reviewed The foraging potential of the Holocene Cape South Coast of South Africa without the Palaeo-Agulhas Plain
Marco Janssen Colin Wren | Published Monday, August 12, 2019The Palaeo-Agulhas Plain formed an important habitat exploited by Pleistocene hunter-gatherer populations during periods of lower sea level. This productive, grassy habitat would have supported numerous large-bodied ungulates accessible to a population of skilled hunters with the right hunting technology. It also provided a potentially rich location for plant food collection, and along its shores a coastline that moved with the rise and fall of sea levels. The rich archaeological and paleontological records of Pleistocene sites along the modern Cape south coast of South Africa, which would have overlooked the Palaeo-Agulhas Plain during Pleistocene times of lower sea level, provides a paleoarchive of this extinct ecosystem. In this paper, we present a first order illustration of the “palaeoscape modeling” approach advocated by Marean et al. (2015). We use a resourcescape model created from modern studies of habitat productivity without the Palaeo-Agulhas Plain. This is equivalent to predominant Holocene conditions. We then run an agent-based model of the human foraging system to investigate several research questions. Our agent-based approach uses the theoretical framework of optimal foraging theory to model human foraging decisions designed to optimize the net caloric gains within a complex landscape of spatially and temporally variable resources. We find that during the high sea-levels of MIS 5e (+5-6 m asl) and the Holocene, the absence of the Plain left a relatively poor food base supporting a much smaller population relying heavily on edible plant resources from the current Cape flora. Despite high species diversity of plants with edible storage organs, and marine invertebrates, encounter rates with highly profitable resources were low. We demonstrate that without the Palaeo-Agulhas Plain, human populations must have been small and low density, and exploited plant, mammal, and marine resources with relatively low caloric returns. The exposure and contraction of the Palaeo-Agulhas Plain was likely the single biggest driver of behavioral change during periods of climate change through the Pleistocene and into the transition to the Holocene.
Peer reviewed MADTOR: Model for Assessing Drug Trafficking Organizations Resilience
Deborah Manzi | Published Friday, February 23, 2024Criminal organizations operate in complex changing environments. Being flexible and dynamic allows criminal networks not only to exploit new illicit opportunities but also to react to law enforcement attempts at disruption, enhancing the persistence of these networks over time. Most studies investigating network disruption have examined organizational structures before and after the arrests of some actors but have disregarded groups’ adaptation strategies.
MADTOR simulates drug trafficking and dealing activities by organized criminal groups and their reactions to law enforcement attempts at disruption. The simulation relied on information retrieved from a detailed court order against a large-scale Italian drug trafficking organization (DTO) and from the literature.
The results showed that the higher the proportion of members arrested, the greater the challenges for DTOs, with higher rates of disrupted organizations and long-term consequences for surviving DTOs. Second, targeting members performing specific tasks had different impacts on DTO resilience: targeting traffickers resulted in the highest rates of DTO disruption, while targeting actors in charge of more redundant tasks (e.g., retailers) had smaller but significant impacts. Third, the model examined the resistance and resilience of DTOs adopting different strategies in the security/efficiency trade-off. Efficient DTOs were more resilient, outperforming secure DTOs in terms of reactions to a single, equal attempt at disruption. Conversely, secure DTOs were more resistant, displaying higher survival rates than efficient DTOs when considering the differentiated frequency and effectiveness of law enforcement interventions on DTOs having different focuses in the security/efficiency trade-off.
Overall, the model demonstrated that law enforcement interventions are often critical events for DTOs, with high rates of both first intention (i.e., DTOs directly disrupted by the intervention) and second intention (i.e., DTOs terminating their activities due to the unsustainability of the intervention’s short-term consequences) culminating in dismantlement. However, surviving DTOs always displayed a high level of resilience, with effective strategies in place to react to threatening events and to continue drug trafficking and dealing.
Formal Organization Hierarchy and Informal Networks - "The Company Behind the Org Chart"
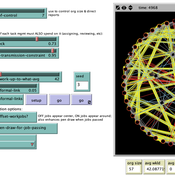
Tom Briggs | Published Sunday, April 18, 2021A generalized organizational agent- based model (ABM) containing both formal organizational hierarchy and informal social networks simulates organizational processes that occur over both formal network ties and informal networks.
A Multi-level Multi-model of Collective Motion
Benjamin Camus Christine Bourjot Vincent Chevrier | Published Wednesday, March 25, 2015This multi-model (i.e. a model composed of interacting submodels) is a multi-level representation of a collective motion phenomenon. It was designed to study the impact of the mutual influences between individuals and groups in collective motion.
Composite Collective Decision Making - ant colony foraging model
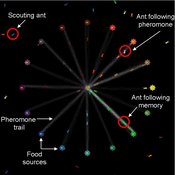
Tomer Czaczkes Benjamin I Czaczkes | Published Thursday, December 17, 2015The model explores how two types of information - social (in the form of pheromone trails) and private (in the form of route memories) affect ant colony level foraging in a variable enviroment.
Peer reviewed CHIME ABM Hurricane Evacuation Model
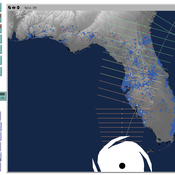
Joshua Watts | Published Friday, March 03, 2017 | Last modified Wednesday, May 29, 2019The CHIME ABM explores information distribution networks and agents’ protective decision making in the context of hurricane landfall.
RAGE RAngeland Grazing Model
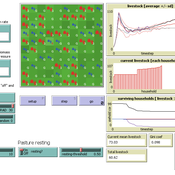
Carsten M Buchmann Jule Thober Birgit Müller Karin Frank Cheng Guo Jürgen Groeneveld Gunnar Dressler Niklas Hase | Published Monday, July 17, 2017 | Last modified Friday, October 26, 2018RAGE models a stylized common property grazing system. Agents follow a certain behavioral type. The model allows analyzing how household behavior with respect to a social norm on pasture resting affects long-term social-ecological system dynamics.
Large-scale land acqusitions and smallholder food security
Tim Williams | Published Thursday, September 16, 2021Large-scale land acquisitions (LSLAs) threaten smallholder livelihoods globally. Despite more than a decade of research on the LSLA phenomenon, it remains a challenge to identify governance conditions that may foster beneficial outcomes for both smallholders and investors. One potentially promising strategy toward this end is contract farming (CF), which more directly involves smallholder households in commodity production than conditions of acquisition and displacement.
To improve understanding of how CF may mediate the outcomes of LSLAs, we developed an agent-based model of smallholder livelihoods, which we used as a virtual laboratory to experiment on a range of hypothetical LSLA and CF implementation scenarios.
The model represents a community of smallholder households in a mixed crop-livestock system. Each agent farms their own land and manages a herd of livestock. Agents can also engage in off-farm employment, for which they earn a fixed wage and compete for a limited number of jobs. The principal model outputs include measures of household food security (representing access to a single, staple food crop) and agricultural production (of a single, staple food crop).
…
Displaying 10 of 233 results for "Paulien Herder" clear search
