About the CoMSES Model Library more info
Our mission is to help computational modelers develop, document, and share their computational models in accordance with community standards and good open science and software engineering practices. Model authors can publish their model source code in the Computational Model Library with narrative documentation as well as metadata that supports open science and emerging norms that facilitate software citation, computational reproducibility / frictionless reuse, and interoperability. Model authors can also request private peer review of their computational models. Models that pass peer review receive a DOI once published.
All users of models published in the library must cite model authors when they use and benefit from their code.
Please check out our model publishing tutorial and feel free to contact us if you have any questions or concerns about publishing your model(s) in the Computational Model Library.
We also maintain a curated database of over 7500 publications of agent-based and individual based models with detailed metadata on availability of code and bibliometric information on the landscape of ABM/IBM publications that we welcome you to explore.
Displaying 10 of 251 results for "Kim Hill" clear search
(Policy induced) Diffusion of Innovations - An integrated demand-supply Model based on Cournot Competition
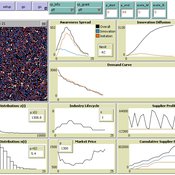
Martin Rixin | Published Monday, August 29, 2011 | Last modified Saturday, April 27, 2013Objective is to simulate policy interventions in an integrated demand-supply model. The underlying demand function links both sides. Diffusion proceeds if interactions distribute awareness (Epidemic effect) and rivalry reduces the market price (Probit effect). Endogeneity is given due to the fact that consumer awareness as well as their willingness-to-pay drives supply-side rivalry. Firm´s entry and exit decisions as well as quantity and price settings are driven by Cournot competition.
Agent-based model of risk behavior in adolescence
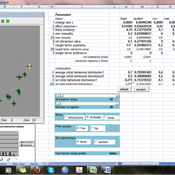
N Schuhmacher P Van Geert L Ballato | Published Monday, June 24, 2013 | Last modified Monday, April 08, 2019The computer model simulates the development of a social network (i.e. formation of friendships and cliques), the (dyadic) interactions between pupils and the development of similarities and differences in their behavioral profiles.
ForagerNet3_Demography: A Non-Spatial Model of Hunter-Gatherer Demography
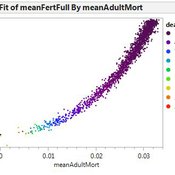
Andrew White | Published Thursday, October 17, 2013 | Last modified Thursday, October 17, 2013ForagerNet3_Demography is a non-spatial ABM for exploring hunter-gatherer demography. Key methods represent birth, death, and marriage. The dependency ratio is an imporant variable in many economic decisions embedded in the methods.
ForagerNet3_Demography_V2
Andrew White | Published Thursday, February 13, 2014ForagerNet3_Demography_V2 is a non-spatial ABM for exploring hunter-gatherer demography. This version (developed from FN3D_V1) contains code for calculating the ratio of old to young adults (the “OY ratio”) in the living and dead populations.
Irrigation Equity and Efficiency
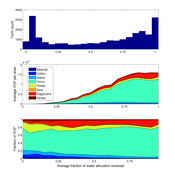
Andrew Bell | Published Tuesday, August 30, 2016The purpose of this model is to examine equity and efficiency in crop production across a system of irrigated farms, as a function of maintenance costs, assessed water fees, and the capacity of farmers to trade water rights among themselves.
Product Diffusion Model in an Advance Selling Strategy
Peng Shao | Published Tuesday, March 15, 2016 | Last modified Tuesday, March 15, 2016the model can be used to describe the product diffusion in an Advance Selling Strategy. this model takes into account the consumers product adoption, and describe consumer’s online behavior based on four states.
CPNorm
Ruth Meyer | Published Sunday, June 04, 2017 | Last modified Tuesday, June 13, 2017CPNorm is a model of a community of harvesters using a common pool resource where adhering to the optimal extraction level has become a social norm. The model can be used to explore the robustness of norm-driven cooperation in the commons.
Modeling a Victim-Centered Approach for Detection of Human Trafficking Victims within Migration Flows
Kyle Ballard Brant M Horio | Published Saturday, September 23, 2017The model employs an agent-based model for exploring the victim-centered approach to identifying human trafficking and the approach’s effectiveness in an abstract representation of migrant flows.
Direct versus Connect
Steven Kimbrough | Published Sunday, January 15, 2023This NetLogo model is an implementation of the mostly verbal (and graphic) model in Jarret Walker’s Human Transit: How Clearer Thinking about Public Transit Can Enrich Our Communities and Our Lives (2011). Walker’s discussion is in the chapter “Connections or Complexity?”. See especially figure 12-2, which is on page 151.
In “Connections or Complexity?”, Walker frames the matter as involving a choice between two conflicting goals. The first goal is to minimize connections, the need to make transfers, in a transit system. People naturally prefer direct routes. The second goal is to minimize complexity. Why? Well, read the chapter, but as a general proposition we want to avoid unnecessary complexity with its attendant operating characteristics (confusing route plans in the case of transit) and management and maintenance challenges. With complexity general comes degraded robustness and resilience.
How do we, how can we, choose between these conflicting goals? The grand suggestion here is that we only choose indirectly, implicitly. In the present example of connections versus complexity we model various alternatives and compare them on measures of performance (MoP) other than complexity or connections per se. The suggestion is that connections and complexity are indicators of, heuristics for, other MoPs that are more fundamental, such as cost, robustness, energy use, etc., and it is these that we at bottom care most about. (Alternatively, and not inconsistently, we can view connections and complexity as two of many MoPs, with the larger issue to be resolve in light of many MoPs, including but not limited to complexity and connections.) We employ modeling to get a handle on these MoPs. Typically, there will be several, taking us thus to a multiple criteria decision making (MCDM) situation. That’s the big picture.
Evolution of cooperation, punishment and retaliation
Marco Janssen | Published Friday, September 06, 2013Cultural group selection model of agents playing public good games and who are able to punish and punish back.
Displaying 10 of 251 results for "Kim Hill" clear search
