Our mission is to help computational modelers develop, document, and share their computational models in accordance with community standards and good open science and software engineering practices. Model authors can publish their model source code in the Computational Model Library with narrative documentation as well as metadata that supports open science and emerging norms that facilitate software citation, computational reproducibility / frictionless reuse, and interoperability. Model authors can also request private peer review of their computational models. Models that pass peer review receive a DOI once published.
All users of models published in the library must cite model authors when they use and benefit from their code.
Please check out our model publishing tutorial and feel free to contact us if you have any questions or concerns about publishing your model(s) in the Computational Model Library.
Displaying 10 of 1022 results for "Chantal van Esch" clear search
Gender differentiation model
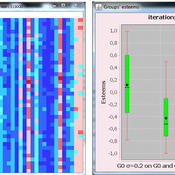
Sylvie Huet | Published Monday, April 20, 2020 | Last modified Thursday, April 23, 2020This is a gender differentiation model in terms of reputations, prestige and self-esteem (presented in the paper https://journals.plos.org/plosone/article?id=10.1371/journal.pone.0236840). The model is based on the influence function of the Leviathan model (Deffuant, Carletti, Huet 2013 and Huet and Deffuant 2017) considering two groups.
This agent-based model studies how inequalities can be explained by the difference of open-mindness between two groups of interacting agents. We consider agents having an opinion/esteem about each other and about themselves. During dyadic meetings, agents change their respective opinion about each other and possibly about other agents they gossip about, with a noisy perception of the opinions of their interlocutor. Highly valued agents are more influential in such encounters. We study an heterogeneous population of two different groups: one more open to influence of others, taking less into account their perceived difference of esteem, called L; a second one less prone to it, called S, who designed the credibility they give to others strongly based on how higher or lower valued than themselves they perceive them.
We show that a mixed population always turns in favor to some agents belonging to the group of less open-minded agents S, and harms the other group: (1) the average group self-opinion or reputation of S is always better than the one of L; (2) the higher rank in terms of reputation are more frequently occupied by the S agents while the L agents occupy more the bottom rank; (3) the properties of the dynamics of differentiation between the two groups are similar to the properties of the glass ceiling effect proposed by Cotter et al (2001).
02 OamLab V1.10 - Open Atwood Machine Laboratory
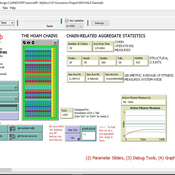
Garvin Boyle | Published Saturday, January 31, 2015 | Last modified Thursday, April 13, 2017Using chains of replicas of Atwood’s Machine, this model explores implications of the Maximum Power Principle. It is one of a series of models exploring the dynamics of sustainable economics – PSoup, ModEco, EiLab, OamLab, MppLab, TpLab, EiLab.
RBM - A Relation-based model - a fishery implementation
Nanda Wijermans Maja Schlüter Anja Klein Tilman Hertz | Published Monday, March 17, 2025The Relation-Based Model (RBM) purpose is to operationalise (a form of) process-relational (PR) thinking to serve as a thinking tool for process-relational thinking among social-ecological system (SES) researchers. The development of this model itself has been a ‘Proof of concept’- exercise to see whether we actually represent process-relational thinking in a methodology that is entity-based (ABM).
The target of the agent-based model is to show the emergence, change and disappearance of fishing assemblages (focusing on processes of self-organisation) in a Mexican fishery using a process-relational view. From this view, a fishery is regarded as an assemblage in which fishing can be enabled, fishing can occur, and fish can be bought/sold. These core doings - or sub-assemblages or capacities - maintain the assemblage. Each (sub)assemblage reflects different actualisations of constellations of relations and elements (buyers, fishers, fuel, permits, vessels and wind). The RBM thereby reflects an artificial fishery in which agents (elements) and their links (relations) engage in (enabling) fishing and buying/selling.
Forager mobility and interaction
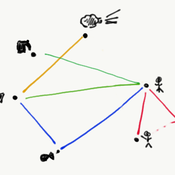
L S Premo | Published Thursday, January 10, 2013 | Last modified Saturday, April 27, 2013This is a relatively simple foraging-radius model, as described first by Robert Kelly, that allows one to quantify the effect of increased logistical mobility (as represented by increased effective foraging radius, r_e) on the likelihood that 2 randomly placed central place foragers will encounter one another within 5000 time steps.
Peer reviewed The Andean Resource Management Model (ARMM)
Olga Palacios | Published Tuesday, January 20, 2026ARMM is a theoretical agent-based model that formalizes Murra’s Theory of Verticality (Murra, 1972) to explore how multi-zonal resource management systems emerge in mountain landscapes. The model identifies the social, political, and economic mechanisms that enable vertical complementarity across ecological gradients.
Built in NetLogo, ARMM employs an abstract 111×111 grid divided into four Andean ecological zones (Altiplano, Highland, Lowland, Coast), each containing up to 18 resource types distributed according to ecological suitability. To test general theoretical principles rather than replicate specific geography, resource locations are randomized at each model initialization.
Settlement agents pursue one of two economic strategies: diversification (seeking resource variety, maximum 2 units per type) or accumulation (maximising total quantity, maximum 30 units). Agents move between adjacent zones through hierarchical decision-making, first attempting peaceful interactions—coexistence (governed by tolerance) and trading (governed by cooperation)—before resorting to conflict (theft or takeover, governed by belligerence).
The model demonstrates that vertical complementarity can emerge through fundamentally different mechanisms: either through autonomous mobility under political decentralization or through state-coordinated redistribution under centralization. Sensitivity analysis reveals that belligerence and economic strategy explain approximately 25% of outcome variance, confirming that structural inequalities between zones result from political-economic organization rather than environmental constraints alone.
As a preliminary theoretical model, ARMM intentionally maintains simplicity to isolate core mechanisms and generate testable hypotheses. This foundational framework will guide future empirically-calibrated versions that incorporate specific archaeological settlement data and geographic features from the Carangas region (Bolivia-Chile border), enabling direct comparison between theoretical predictions and observed historical patterns.
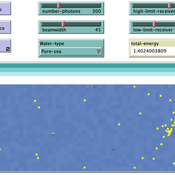
ABM for Underwater optical wireless communication in a water tank
Mohamed ABID | Published Sunday, May 29, 2022This model simulates the propagation of photons in a water tank. A source of light emits an impulse of photons with equal energy represented by yellow dots. These photons are then scattered by water particles before possibly reaching the photo-detector represented by a gray line. Different types of water are considered. For each one of them we calculate the total received energy.
The water tank is represented by a blue rectangle with fixed dimensions. It’s exposed to the air interface and has totally absorbent barriers. Four types of water are supported. Each one is characterized by its absorption and scattering coefficients.
At the source, the photons are generated uniformly with a random direction within the beamwidth. Each photon travels a random distance drawn from a distribution depending on the water characteristics before encountering a water particle.
Based on the updated position of the photon, three situations may occur:
-The photon hits the barrier of the tank on its trajectory. In this case it’s considered as lost since the barriers are assumed totally absorbent.
…
Crowdworking Model
Georg Jäger | Published Wednesday, September 25, 2019The purpose of this agent-based model is to compare different variants of crowdworking in a general way, so that the obtained results are independent of specific details of the crowdworking platform. It features many adjustable parameters that can be used to calibrate the model to empirical data, but also when not calibrated it yields essential results about crowdworking in general.
Agents compete for contracts on a virtual crowdworking platform. Each agent is defined by various properties like qualification and income expectation. Agents that are unable to turn a profit have a chance to quit the crowdworking platform and new crowdworkers can replace them. Thus the model has features of an evolutionary process, filtering out the ill suited agents, and generating a realistic distribution of agents from an initially random one. To simulate a stable system, the amount of contracts issued per day can be set constant, as well as the number of crowdworkers. If one is interested in a dynamically changing platform, the simulation can also be initialized in a way that increases or decreases the number of crowdworkers or number of contracts over time. Thus, a large variety of scenarios can be investigated.
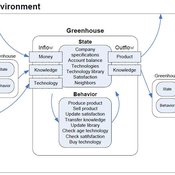
Universal Darwinism in Dutch Greenhouses
Julia Kasmire | Published Wednesday, May 09, 2012 | Last modified Saturday, April 27, 2013An ABM, derived from a case study and a series of surveys with greenhouse growers in the Westland, Netherlands. Experiments using this model showshow that the greenhouse horticulture industry displays diversity, adaptive complexity and an uneven distribution, which all suggest that the industry is an evolving system.
Extended Flache and Mas (2008)
Hadi Aliahmadi | Published Wednesday, August 16, 2017 | Last modified Monday, February 26, 2018We extend the Flache-Mäs model to incorporate the location and dyadic communication regime of the agents in the opinion formation process. We make spatially proximate agents more likely to interact with each other in a pairwise communication regime.
UK Demographic Simulator
Tony Lawson | Published Monday, February 27, 2012 | Last modified Tuesday, October 21, 2014A dynmaic microsimulation model to project the UK population over time
Displaying 10 of 1022 results for "Chantal van Esch" clear search