Our mission is to help computational modelers develop, document, and share their computational models in accordance with community standards and good open science and software engineering practices. Model authors can publish their model source code in the Computational Model Library with narrative documentation as well as metadata that supports open science and emerging norms that facilitate software citation, computational reproducibility / frictionless reuse, and interoperability. Model authors can also request private peer review of their computational models. Models that pass peer review receive a DOI once published.
All users of models published in the library must cite model authors when they use and benefit from their code.
Please check out our model publishing tutorial and feel free to contact us if you have any questions or concerns about publishing your model(s) in the Computational Model Library.
Displaying 8 of 158 results for "K De Boo" clear search
Peer reviewed Kenya ITN Agent-Based Microsimulation (2003–2024)
Wooyoung Kim Hosang Shin | Published Saturday, April 18, 2026 | Last modified Tuesday, June 16, 2026An agent-based microsimulation of insecticide-treated net (ITN) distribution and adoption in Kenya (2003–2024), integrating the Theory of Planned Behaviour, Rogers diffusion, Weibull net decay, and a GPS-based two-layer social network. 8,561 household agents calibrated via Approximate Bayesian Computation to six DHS/MIS survey waves, achieving 2.42 pp mean absolute error on Kenya-level ownership. The analysis chain supports mechanism counterfactuals and policy experiments on equity outcomes of ITN distribution strategies.
Open Peer Review Model
Federico Bianchi | Published Monday, May 24, 2021This is an agent-based model of a population of scientists alternatively authoring or reviewing manuscripts submitted to a scholarly journal for peer review. Peer-review evaluation can be either ‘confidential’, i.e. the identity of authors and reviewers is not disclosed, or ‘open’, i.e. authors’ identity is disclosed to reviewers. The quality of the submitted manuscripts vary according to their authors’ resources, which vary according to the number of publications. Reviewers can assess the assigned manuscript’s quality either reliably of unreliably according to varying behavioural assumptions, i.e. direct/indirect reciprocation of past outcome as authors, or deference towards higher-status authors.
Forager mobility and interaction
L S Premo | Published Thursday, January 10, 2013 | Last modified Saturday, April 27, 2013This is a relatively simple foraging-radius model, as described first by Robert Kelly, that allows one to quantify the effect of increased logistical mobility (as represented by increased effective foraging radius, r_e) on the likelihood that 2 randomly placed central place foragers will encounter one another within 5000 time steps.
Peer reviewed The Viability of the Social-Ecological Agroecosystem (ViSA) Spatial Agent-based Model
Mostafa Shaaban | Published Friday, June 03, 2022ViSA simulates the decision behaviors of different stakeholders showing demands for ecosystem services (ESS) in agricultural landscape. The lack of sufficient supply of ESSs triggers stakeholders to apply different management options to increase their supply. However, while attempting to reduce the supply-demand gap, conflicts arise among stakeholders due to the tradeoff nature of some ESS. ViSA investigates conditions and scenarios that can minimize such supply-demand gap while reducing the risk of conflicts by suggesting different mixes of management options and decision rules.
LogoClim: WorldClim in NetLogo
Daniel Vartanian Leandro Garcia Aline Martins de Carvalho Aline | Published Thursday, July 03, 2025 | Last modified Monday, July 13, 2026LogoClim is a NetLogo model designed to be integrated into other simulations through the LevelSpace extension (Hjorth et al., 2020), providing high resolution climate data from sources validated and used by the Intergovernmental Panel on Climate Change (IPCC).
The model simplifies and standardizes the integration of climate data into NetLogo, allowing researchers to focus their efforts on the model itself with the assurance of using reliable and widely recognized data. Although its main use is as a component of larger simulations, LogoClim also has its own graphical interface for monitoring and checking the datasets.
The climate data comes from the WorldClim 2.1 project (Fick & Hijmans, 2017), for which LogoClim works as an interface to NetLogo. The model supports all three WorldClim data series: (1) Historical Climate Data (1970 to 2000), with 12 monthly points for minimum, mean, and maximum temperature, precipitation, solar radiation, wind speed, vapor pressure, elevation, and bioclimatic variables; (2) Historical Monthly Weather Data (1951 to 2024), based on downscaling of CRU-TS-4.09, developed by the Climatic Research Unit at the University of East Anglia (Harris et al., 2020), with minimum and maximum temperature and total precipitation; and (3) Future Climate Data, based on downscaling climate projections derived from global climate models of the Coupled Model Intercomparison Project Phase 6 (CMIP6) (Eyring et al., 2016) for four future periods (2021 to 2040, 2041 to 2060, 2061 to 2080, and 2081 to 2100) and four scenarios based on the Shared Socioeconomic Pathways (SSPs 126, 245, 370, and 585), covering minimum and maximum temperature, total precipitation, and bioclimatic variables. All series are available at multiple spatial resolutions, from 10 minutes (about 340 km² at the equator) to 30 seconds (about 1 km² at the equator).
…
Peer reviewed Neighbor Influenced Energy Retrofit (NIER) agent-based model
Eric Boria | Published Friday, April 03, 2020The NIER model is intended to add qualitative variables of building owner types and peer group scales to existing energy efficiency retrofit adoption models. The model was developed through a combined methodology with qualitative research, which included interviews with key stakeholders in Cleveland, Ohio and Detroit and Grand Rapids, Michigan. The concepts that the NIER model adds to traditional economic feasibility studies of energy retrofit decision-making are differences in building owner types (reflecting strategies for managing buildings) and peer group scale (neighborhoods of various sizes and large-scale Districts). Insights from the NIER model include: large peer group comparisons can quickly raise the average energy efficiency values of Leader and Conformist building owner types, but leave Stigma-avoider owner types as unmotivated to retrofit; policy interventions such as upgrading buildings to energy-related codes at the point of sale can motivate retrofits among the lowest efficient buildings, which are predominantly represented by the Stigma-avoider type of owner; small neighborhood peer groups can successfully amplify normal retrofit incentives.
Peer reviewed The Viability of the Social-Ecological Agroecosystem (ViSA) Spatial Agent-based Model
Mostafa Shaaban | Published Monday, March 25, 2024ViSA 2.0.0 is an updated version of ViSA 1.0.0 aiming at integrating empirical data of a new use case that is much smaller than in the first version to include field scale analysis. Further, the code of the model is simplified to make the model easier and faster. Some features from the previous version have been removed.
It simulates decision behaviors of different stakeholders showing demands for ecosystem services (ESS) in agricultural landscape. It investigates conditions and scenarios that can increase the supply of ecosystem services while keeping the viability of the social system by suggesting different mixes of initial unit utilities and decision rules.
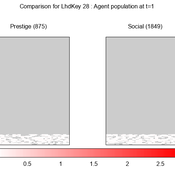
We provide a theory-grounded, socio-geographic agent-based model to present a possible explanation for human movement in the Adriatic region within the Cetina phenomenon.
Focusing on ideas of social capital theory from Piere Bordieu (1986), we implement agent mobility in an abstract geography based on cultural capital (prestige) and social capital (social position). Agents hold myopic representations of social (Schaff, 2016) and geographical networks and decide in a heuristic way on moving (and where) or staying.
The model is implemented in a fork of the Laboratory for Simulation Development (LSD), appended with GIS capabilities (Pereira et. al. 2020).
Displaying 8 of 158 results for "K De Boo" clear search