Our mission is to help computational modelers develop, document, and share their computational models in accordance with community standards and good open science and software engineering practices. Model authors can publish their model source code in the Computational Model Library with narrative documentation as well as metadata that supports open science and emerging norms that facilitate software citation, computational reproducibility / frictionless reuse, and interoperability. Model authors can also request private peer review of their computational models. Models that pass peer review receive a DOI once published.
All users of models published in the library must cite model authors when they use and benefit from their code.
Please check out our model publishing tutorial and feel free to contact us if you have any questions or concerns about publishing your model(s) in the Computational Model Library.
Displaying 10 of 119 results for "Martina Casari" clear search
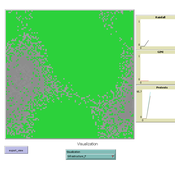
MEGADAPT - Socio-hydrological risk model - Theoretical (no data) implementation
Marco Janssen Andres Baeza-Castro Luis Bojorquez Hallie Eakin | Published Wednesday, February 06, 2019The model simulates the decisions of residents and a water authority to respond to socio-hydrological hazards. Residents from neighborhoods are located in a landscape with topographic complexity and two problems: water scarcity in the peripheral neighborhoods at high altitude and high risk of flooding in the lowlands, at the core of the city. The role of the water authority is to decide where investments in infrastructure should be allocated to reduce the risk to water scarcity and flooding events in the city, and these decisions are made via a multi-objective site selection procedure. This procedure accounts for the interdependencies and feedback between the urban landscape and a policy scenario that defines the importance, or priorities, that the authority places on four criteria.
Neighborhoods respond to the water authority decisions by protesting against the lack of investment and the level of exposure to water scarcity and flooding. Protests thus simulate a form of feedback between local-level outcomes (flooding and water scarcity) and higher-level decision-making. Neighborhoods at high altitude are more likely to be exposed to water scarcity and lack infrastructure, whereas neighborhoods in the lowlands tend to suffer from recurrent flooding. The frequency of flooding is also a function of spatially uniform rainfall events. Likewise, neighborhoods at the periphery of the urban landscape lack infrastructure and suffer from chronic risk of water scarcity.
The model simulates the coupling between the decision-making processes of institutional actors, socio-political processes and infrastructure-related hazards. In the documentation, we describe details of the implementation in NetLogo, the description of the procedures, scheduling, and the initial conditions of the landscape and the neighborhoods.
This work was supported by the National Science Foundation under Grant No. 1414052, CNH: The Dynamics of Multi-Scalar Adaptation in Megacities (PI Hallie Eakin).
This model extends the original Artifical Anasazi (AA) model to include individual agents, who vary in age and sex, and are aggregated into households. This allows more realistic simulations of population dynamics within the Long House Valley of Arizona from AD 800 to 1350 than are possible in the original model. The parts of this model that are directly derived from the AA model are based on Janssen’s 1999 Netlogo implementation of the model; the code for all extensions and adaptations in the model described here (the Artificial Long House Valley (ALHV) model) have been written by the authors. The AA model included only ideal and homogeneous “individuals” who do not participate in the population processes (e.g., birth and death)–these processes were assumed to act on entire households only. The ALHV model incorporates actual individual agents and all demographic processes affect these individuals. Individuals are aggregated into households that participate in annual agricultural and demographic cycles. Thus, the ALHV model is a combination of individual processes (birth and death) and household-level processes (e.g., finding suitable agriculture plots).
As is the case for the AA model, the ALHV model makes use of detailed archaeological and paleoenvironmental data from the Long House Valley and the adjacent areas in Arizona. It also uses the same methods as the original model (from Janssen’s Netlogo implementation) to estimate annual maize productivity of various agricultural zones within the valley. These estimates are used to determine suitable locations for households and farms during each year of the simulation.
Artificial Long House Valley-Black Mesa
Lisa Sattenspiel Amy Warren | Published Thursday, March 19, 2020This model is an extension of the Artificial Long House Valley (ALHV) model developed by the authors (Swedlund et al. 2016; Warren and Sattenspiel 2020). The ALHV model simulates the population dynamics of individuals within the Long House Valley of Arizona from AD 800 to 1350. Individuals are aggregated into households that participate in annual agricultural and demographic cycles. The present version of the model incorporates features of the ALHV model including realistic age-specific fertility and mortality and, in addition, it adds the Black Mesa environment and population, as well as additional methods to allow migration between the two regions.
As is the case for previous versions of the ALHV model as well as the Artificial Anasazi (AA) model from which the ALHV model was derived (Axtell et al. 2002; Janssen 2009), this version makes use of detailed archaeological and paleoenvironmental data from the Long House Valley and the adjacent areas in Arizona. It also uses the same methods as the original AA model to estimate annual maize productivity of various agricultural zones within the Long House Valley. A new environment and associated methods have been developed for Black Mesa. Productivity estimates from both regions are used to determine suitable locations for households and farms during each year of the simulation.
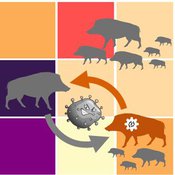
Classical Swine Fever in wild boars
Volker Grimm Stephanie Kramer-Schadt Cédric Scherer Martin Lange Hans-Hermann Thulke | Published Friday, September 06, 2019The model is a combination of a spatially explicit, stochastic, agent-based model for wild boars (Sus scrofa L.) and an epidemiological model for the Classical Swine Fever (CSF) virus infecting the wild boars.
The original model (Kramer-Schadt et al. 2009) was used to assess intrinsic (system immanent host-pathogen interaction and host life-history) and extrinsic (spatial extent and density) factors contributing to the long-term persistence of the disease and has further been used to assess the effects of intrinsic dynamics (Lange et al. 2012a) and indirect transmission (Lange et al. 2016) on the disease course. In an applied context, the model was used to test the efficiency of spatiotemporal vaccination regimes (Lange et al. 2012b) as well as the risk of disease spread in the country of Denmark (Alban et al. 2005).
References: See ODD model description.
Proof of principle for a self-governing prediction and forecasting reward algorithm: Modeling consensus of a group of experts in adversarial collaboration.
Jose Osvaldo Gonzalez Hernandez Ted C. Rogers Jonathan Marino Brandon Velasco | Published Sunday, May 14, 2023Package for simulating the behavior of experts in a scientific-forecasting competition, where the outcome of experiments itself depends on expert consensus. We pay special attention to the interplay between expert bias and trust in the reward algorithm. The package allows the user to reproduce results presented in arXiv:2305.04814, as well as testing of other different scenarios.
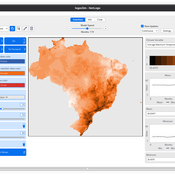
LogoClim: WorldClim in NetLogo
Daniel Vartanian Leandro Garcia Aline Martins de Carvalho Aline | Published Thursday, July 03, 2025 | Last modified Monday, July 13, 2026LogoClim is a NetLogo model designed to be integrated into other simulations through the LevelSpace extension (Hjorth et al., 2020), providing high resolution climate data from sources validated and used by the Intergovernmental Panel on Climate Change (IPCC).
The model simplifies and standardizes the integration of climate data into NetLogo, allowing researchers to focus their efforts on the model itself with the assurance of using reliable and widely recognized data. Although its main use is as a component of larger simulations, LogoClim also has its own graphical interface for monitoring and checking the datasets.
The climate data comes from the WorldClim 2.1 project (Fick & Hijmans, 2017), for which LogoClim works as an interface to NetLogo. The model supports all three WorldClim data series: (1) Historical Climate Data (1970 to 2000), with 12 monthly points for minimum, mean, and maximum temperature, precipitation, solar radiation, wind speed, vapor pressure, elevation, and bioclimatic variables; (2) Historical Monthly Weather Data (1951 to 2024), based on downscaling of CRU-TS-4.09, developed by the Climatic Research Unit at the University of East Anglia (Harris et al., 2020), with minimum and maximum temperature and total precipitation; and (3) Future Climate Data, based on downscaling climate projections derived from global climate models of the Coupled Model Intercomparison Project Phase 6 (CMIP6) (Eyring et al., 2016) for four future periods (2021 to 2040, 2041 to 2060, 2061 to 2080, and 2081 to 2100) and four scenarios based on the Shared Socioeconomic Pathways (SSPs 126, 245, 370, and 585), covering minimum and maximum temperature, total precipitation, and bioclimatic variables. All series are available at multiple spatial resolutions, from 10 minutes (about 340 km² at the equator) to 30 seconds (about 1 km² at the equator).
…
Alternative scenarios of green consumption in Italy: an empirically grounded model.
Giangiacomo Bravo Elena Vallino Alessandro K Cerutti Maria Beatrice Pairotti | Published Thursday, March 28, 2013 | Last modified Saturday, April 27, 2013We provide a full description of the model following the ODD protocol (Grimm et al. 2010) in the attached document. The model is developed in NetLogo 5.0 (Wilenski 1999).
Last Mile Commuter Behavior Model
Dean Massey Moira Zellner Yoram Shiftan Jonathan Levine Maria Arquero | Published Friday, November 07, 2014 | Last modified Friday, November 07, 2014We represent commuters and their preferences for transportation cost, time and safety. Agents assess their options via their preferences, their environment, and the modes available. The model has policy levers to test impact on last-mile problem.
World of Cows - Exploring land-use policies for a dairy-farm world (teaching modeling complex human-environment systems)
Maria Haensel Thomas Michael Schmitt Jakob Bogenreuther | Published Wednesday, January 11, 2023In the “World of Cows”, dairy farmers run their farms and interact with each other, the surrounding agricultural landscape, and the economic and political framework. The model serves as an exemplary case of an interdependent human-environment system.
With the model, users can analyze the influence of policies and markets on land use decisions of dairy farms. The land use decisions taken by farms determine the delivered ecosystem services on the landscape level. Users can choose a combination of five policy options and how strongly market prices fluctuate. Ideally, the choice of policy options fulfills the following three “political goals” 1) dairy farming stays economically viable, 2) the provision of ecosystem services is secured, and 3) government spending on subsidies is as low as possible.
The model has been designed for students to practice agent-based modeling and analyze the impacts of land use policies.
This model presents an autonomous, two-lane driving environment with a single lane-closure that can be toggled. The four driving scenarios - two baseline cases (based on the real-world) and two experimental setups - are as follows:
- Baseline-1 is where cars are not informed of the lane closure.
- Baseline-2 is where a Red Zone is marked wherein cars are informed of the lane closure ahead.
- Strategy-1 is where cars use a co-operative driving strategy - FAS. <sup>[1]</sup>
- Strategy-2 is a variant of Strategy-1 and uses comfortable deceleration values instead of the vehicle’s limit.
…
Displaying 10 of 119 results for "Martina Casari" clear search