About the CoMSES Model Library more info
Our mission is to help computational modelers develop, document, and share their computational models in accordance with community standards and good open science and software engineering practices. Model authors can publish their model source code in the Computational Model Library with narrative documentation as well as metadata that supports open science and emerging norms that facilitate software citation, computational reproducibility / frictionless reuse, and interoperability. Model authors can also request private peer review of their computational models. Models that pass peer review receive a DOI once published.
All users of models published in the library must cite model authors when they use and benefit from their code.
Please check out our model publishing tutorial and feel free to contact us if you have any questions or concerns about publishing your model(s) in the Computational Model Library.
We also maintain a curated database of over 7500 publications of agent-based and individual based models with detailed metadata on availability of code and bibliometric information on the landscape of ABM/IBM publications that we welcome you to explore.
Displaying 10 of 1188 results for "Ian M Hamilton" clear search
Collective Decision Making for Ecological Restoration
Dean Massey Moira Zellner Cristy Watkins Jeremy Brooks Kristen Ross | Published Friday, December 30, 2011 | Last modified Friday, November 21, 2014We present an agent-based model that maps out and simulates the processes by which individuals within ecological restoration organizations communicate and collectively make restoration decisions.
SimAdapt
François Rebaudo | Published Wednesday, August 29, 2012 | Last modified Monday, October 13, 2014SimAdapt: An individual-based genetic model for simulating landscape management impacts on populations
TERRoir level Organic matter Interactions and Recycling model
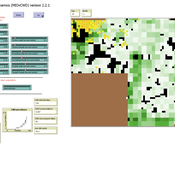
Myriam Grillot | Published Wednesday, April 19, 2017 | Last modified Wednesday, June 17, 2020The TERROIR agent-based model was built for the multi-level analysis of biomass and nutrient flows within agro-sylvo-pastoral villages in West Africa. It explicitly takes into account both human organization and spatial extension of such flows.
A simplified Arthur & Polak logic circuit model of combinatory technology build-out via incremental development. Only some inventions trigger radical effects, suggesting they depend on whole interdependent systems rather than specific innovations.
Peer reviewed MIOvCWD
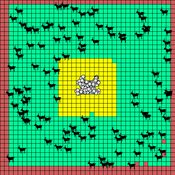
Aniruddha Belsare | Published Friday, December 13, 2019MIOvCWD is a spatially-explicit, agent-based model designed to simulate the spread of chronic wasting disease (CWD) in Michigan’s white-tailed deer populations. CWD is an emerging prion disease of North American cervids (white-tailed deer Odocoileus virginianus, mule deer Odocoileus hemionus, and elk Cervus elaphus) that is being actively managed by wildlife agencies in most states and provinces in North America, including Michigan. MIOvCWD incorporates features like deer population structure, social organization and behavior that are particularly useful to simulate CWD dynamics in regional deer populations.
RBM - A Relation-based model - a fishery implementation
Nanda Wijermans Maja Schlüter Anja Klein Tilman Hertz | Published Monday, March 17, 2025The Relation-Based Model (RBM) purpose is to operationalise (a form of) process-relational (PR) thinking to serve as a thinking tool for process-relational thinking among social-ecological system (SES) researchers. The development of this model itself has been a ‘Proof of concept’- exercise to see whether we actually represent process-relational thinking in a methodology that is entity-based (ABM).
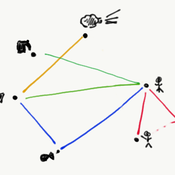
The target of the agent-based model is to show the emergence, change and disappearance of fishing assemblages (focusing on processes of self-organisation) in a Mexican fishery using a process-relational view. From this view, a fishery is regarded as an assemblage in which fishing can be enabled, fishing can occur, and fish can be bought/sold. These core doings - or sub-assemblages or capacities - maintain the assemblage. Each (sub)assemblage reflects different actualisations of constellations of relations and elements (buyers, fishers, fuel, permits, vessels and wind). The RBM thereby reflects an artificial fishery in which agents (elements) and their links (relations) engage in (enabling) fishing and buying/selling.
An agent-based model for assessing strategies of adaptation to climate and tourism demand changes in an alpine destination
Stefano Balbi Marco Alberti | Published Monday, February 14, 2011 | Last modified Saturday, April 27, 2013The model is then used for assessing three hypothetical and contrasted infrastructure-oriented adaptation strategies for the winter tourism industry, that have been previously discussed with local stakeholders, as possible alternatives to the “business-as-usual” situation.
An Agent-Based Model of an Insurer's Estimated Capital Requirement in a Simple Insurance Market with Imperfect Information in C#
Rei England | Published Sunday, September 24, 2023This is an agent-based model of a simple insurance market with two types of agents: customers and insurers. Insurers set premium quotes for each customer according to an estimation of their underlying risk based on past claims data. Customers either renew existing contracts or else select the cheapest quote from a subset of insurers. Insurers then estimate their resulting capital requirement based on a 99.5% VaR of their aggregate loss distributions. These estimates demonstrate an under-estimation bias due to the winner’s curse effect.
The Urban Drought Nexus Tool
Roger Cremades Muhamad Khairulbahri | Published Thursday, December 14, 2023The “Urban Drought Nexus Tool” is a system dynamics model, aiming to facilitate the co-development of climate services for cities under increasing droughts. The tool integrates multiple types of information and still can be applied to other case studies with minimal adjustments on the parameters of land use, water consumption and energy use in the water sector. The tool needs hydrological projections under climate scenarios to evaluate climatic futures, and requires the co-creation of socio-economic future scenarios with local stakeholders. Thus it is possible to provide specific information about droughts taking into account future water availability and future water consumption. Ultimately, such complex system as formed by the water-energy-land nexus can be reduced to single variables of interest, e.g. the number of events with no water available in the future and their length, so that the complexities are reduced and the results can be conveyed to society in an understandable way, including the communication of uncertainties. The tool and an explanatory guide in pdf format are included. Planned further developments include calibrating the system dynamics model with the social dynamics behind each flow with agent-based models.
Peer reviewed Small-Trade Model
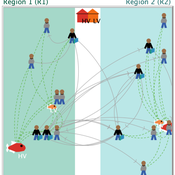
Emilie Lindkvist Maja Schlüter Blanca Gonzalez-Mon Örjan Bodin | Published Wednesday, July 28, 2021The purpose of this model is to understand the role of trade networks and their interaction with different fish resources, for fish provision. The model is developed based on a multi-methods approach, combining agent-based modeling, network analysis and qualitative data based on a small-scale fisheries study case. The model can be used to investigate both how trade network structures are embedded in a social-ecological context and the trade processes that occur within them, to analyze how they lead to emergent outcomes related to the resilience of fish provision. The model processes are informed by qualitative data analysis, and the social network analysis of an empirical fish trade network. The network analysis can be used to investigate diverse network structures to perform model experiments, and their influence on model outcomes.
The main outcomes we study are 1) the overexploitation of fish resources and 2) the availability and variability of fish provision to satisfy different market demands, and 3) individual traders’ fish supply at the micro-level. The model has two types of trader agents, seller and dealer. The model reveals that the characteristics of the trade networks, linked to different trader types (that have different roles in those networks), can affect the resilience of fish provision.
Displaying 10 of 1188 results for "Ian M Hamilton" clear search


