About the CoMSES Model Library more info
Our mission is to help computational modelers develop, document, and share their computational models in accordance with community standards and good open science and software engineering practices. Model authors can publish their model source code in the Computational Model Library with narrative documentation as well as metadata that supports open science and emerging norms that facilitate software citation, computational reproducibility / frictionless reuse, and interoperability. Model authors can also request private peer review of their computational models. Models that pass peer review receive a DOI once published.
All users of models published in the library must cite model authors when they use and benefit from their code.
Please check out our model publishing tutorial and feel free to contact us if you have any questions or concerns about publishing your model(s) in the Computational Model Library.
We also maintain a curated database of over 7500 publications of agent-based and individual based models with detailed metadata on availability of code and bibliometric information on the landscape of ABM/IBM publications that we welcome you to explore.
Displaying 10 of 41 results resilience clear search
Structural Violence and Neurobiological Adaptation: Modeling the Trajectory of Youth Outside of Care
masterpiece33330-prog | Published Thursday, November 27, 2025This study presents a System Dynamics (SD) model that explores the “trajectories of homelessness” among youth outside of the formal care system. Unlike traditional approaches that view runaway behavior as a discrete choice, this model reinterprets it as a neurobiological adaptation to chronic resource deprivation and systemic neglect.
The model incorporates key mechanisms such as ‘Allostatic Load’ accumulation, ‘PFC-Amygdala Switching’, and the ‘Iatrogenic Effects’ of shelter policies. It utilizes Monte Carlo simulations to demonstrate how structural factors create a “probabilistic vulnerability,” trapping youth in cycles of survival crime and isolation regardless of individual resilience.
The uploaded code includes a Python implementation of the model to ensure reproducibility of the stochastic analysis presented in the paper.
FRAMe (Flood Resilience Agent-Based Model)
Wenhan Feng | Published Wednesday, October 22, 2025The FRAMe (Flood Resilience Agent-Based Model) serves as a framework designed to simulate flood resilience dynamics at the community level, focusing on a rural settlement in the Mekong River Basin. Integrating empirical data from extensive surveys, Bayesian networks, and hydrological simulations, the framework quantifies resilience as a trade-off between robustness (resistance to damage) and adaptability (capacity for dynamic response). Agents include households, governments, and other actors, linked by social and governance networks that facilitate knowledge transfer, resource distribution, and risk communication. FRAMe incorporates mechanisms for flood forecasting, policy interventions (education, aid, insurance), and individual and collective decision-making, grounded in Protection Motivation Theory and MoHuB frameworks. The framework’s spatially explicit design leverages GIS data, which supports scenario testing of governance structures and stakeholder interactions. By examining policy scenarios and agent behavior, FRAMe aims to inform adaptive flood management strategies and enhance community resilience.
Tragedy of the Commons with Environmental Feedback: A Model of Human-AI Socio-Environmental Water Dilemma
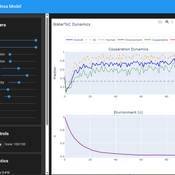
Ivana Malcic Luka Waronig Andrew Crossley | Published Saturday, July 05, 2025 | Last modified Sunday, July 06, 2025This project is an interactive agent-based model simulating consumption of a shared, renewable resource using a game-theoretic framework with environmental feedback. The primary function of this model was to test how resource-use among AI and human agents degrades the environment, and to explore the socio-environmental feedback loops that lead to complex emergent system dynamics. We implemented a classic game theoretic matrix which decides agents´ strategies, and added a feedback loop which switches between strategies in pristine vs degraded environments. This leads to cooperation in bad environments, and defection in good ones.
Despite this use, it can be applicable for a variety of other scenarios including simulating climate disasters, environmental sensitivity to resource consumption, or influence of environmental degradation to agent behaviour.
The ABM was inspired by the Weitz et. al. (2016, https://pubmed.ncbi.nlm.nih.gov/27830651/) use of environmental feedback in their paper, as well as the Demographic Prisoner’s Dilemma on a Grid model (https://mesa.readthedocs.io/stable/examples/advanced/pd_grid.html#demographic-prisoner-s-dilemma-on-a-grid). The main innovation is the added environmental feedback with local resource replenishment.
Beyond its theoretical insights into coevolutionary dynamics, it serves as a versatile tool with several practical applications. For urban planners and policymakers, the model can function as a ”digital sandbox” for testing the impacts of locating high-consumption industrial agents, such as data centers, in proximity to residential communities. It allows for the exploration of different urban densities, and the evaluation of policy interventions—such as taxes on defection or subsidies for cooperation—by directly modifying the agents’ resource consumptions to observe effects on resource health. Furthermore, the model provides a framework for assessing the resilience of such socio-environmental systems to external shocks.
…
Peer reviewed soslivestock model
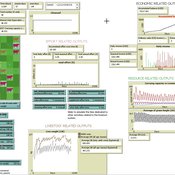
Marco Janssen Irene Perez Ibarra Diego J. Soler-Navarro Alicia Tenza Peral | Published Wednesday, May 28, 2025 | Last modified Tuesday, June 10, 2025The purpose of this model is to analyze how different management strategies affect the wellbeing, sustainability and resilience of an extensive livestock system under scenarios of climate change and landscape configurations. For this purpose, it simulates one cattle farming system, in which agents (cattle) move through the space using resources (grass). Three farmer profiles are considered: 1) a subsistence farmer that emphasizes self-sufficiency and low costs with limited attention to herd management practices, 2) a commercial farmer focused on profit maximization through efficient production methods, and 3) an environmental farmer that prioritizes conservation of natural resources and animal welfare over profit maximization. These three farmer profiles share the same management strategies to adapt to climate and resource conditions, but differ in their goals and decision-making criteria for when, how, and whether to implement those strategies. This model is based on the SequiaBasalto model (Dieguez Cameroni et al. 2012, 2014, Bommel et al. 2014 and Morales et al. 2015), replicated in NetLogo by Soler-Navarro et al. (2023).
One year is 368 days. Seasons change every 92 days. Each step begins with the growth of grass as a function of climate and season. This is followed by updating the live weight of animals according to the grass height of their patch, and grass consumption, which is determined based on the updated live weight. Animals can be supplemented by the farmer in case of severe drought. After consumption, cows grow and reproduce, and a new grass height is calculated. This updated grass height value becomes the starting grass height for the next day. Cows then move to the next area with the highest grass height. After that, cattle prices are updated and cattle sales are held on the first day of fall. In the event of a severe drought, special sales are held. Finally, at the end of the day, the farm balance and the farmer’s effort are calculated.
Protein 2.0: An Agent-Based Model for Simulating Norway’s Protein Sector Under Carbon Pricing and the Emergence of Cultivated Proteins
Gary Polhill Nick Roxburgh Rob J.F. Burton Klaus Mittenzwei | Published Thursday, May 08, 2025Protein 2.0 is a systems model of the Norwegian protein sector designed to explore the potential impacts of carbon taxation and the emergence of cultivated meat and dairy technologies. The model simulates production, pricing, and consumption dynamics across conventional and cultivated protein sources, accounting for emissions intensity, technological learning, economies of scale, and agent behaviour. It assesses how carbon pricing could alter the competitiveness of conventional beef, lamb, pork, chicken, milk, and egg production relative to emerging cultivated alternatives, and evaluates the implications for domestic production, emissions, and food system resilience. The model provides a flexible platform for exploring policy scenarios and transition pathways in protein supply. Further details can be found in the associated publication.
A formalized implementation of Halstead and O’Shea’s Bad Year Economics. The agent population uses one of four resilience strategies in an attempt to cope with a dynamic environment of stresses and shocks.
Peer reviewed Agriculture.Grape.yield.Evaluation.using.NetLogo.based.Technology.Simulation (AGENTS): A NetLogo agent-based model developed to assess viticulture efficiency in Byzantine Shivta.
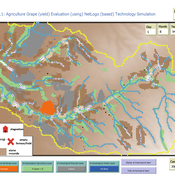
Barak Garty Gil Gambash Guy BarOz Sharona T Levy | Published Friday, December 06, 2024AGENTS model is an agent-based computational framework designed to explore the socio-ecological and economic dynamics of agricultural production in the Byzantine Negev Highlands, with a focus on viticulture. It integrates historical, environmental, and social factors to simulate settlement sustainability, crop yields, and the impacts of varying climate conditions. The model is built in NetLogo and incorporates GIS-based topographical and hydrological data. Key features include the ability to assess climate impacts on crop profitability and settlement strategies, evaluate economic outputs of ancient vineyards, and simulate agent decision-making processes under diverse scenarios.
The AGENTS model is highly flexible, enabling users to simulate agricultural regimes with any two crops: one cash crop (a crop grown for profit, e.g., grapevines) and one staple crop (a crop grown for subsistence, e.g., wheat). While the default setup models viticulture and wheat cultivation in the Byzantine Negev Highlands, users can adapt the model to different environmental and socio-ecological contexts worldwide—both past and present.
Users can load external files to customize precipitation, evaporation, topography, and labor costs (measured as man-days per 0.1ha, converted to kg of wheat per model patch size area), and can also edit key parameters related to yield calculations. This includes modifying crop-specific yield formulas, soil and runoff indices, and any factors influencing crop performance. The model inherently simulates cash crops grown in floodplain regions and staple crops cultivated along riverbanks, providing a powerful tool to investigate societal resilience and responses to climate stressors across diverse environments.
…
Team Structure and Task Performance
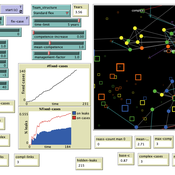
Davide Secchi Martin Neumann | Published Monday, August 05, 2024This model was designed to study resilience in organizations. Inspired by ethnographic work, it follows the simple goal to understand whether team structure affects the way in which tasks are performed. In so doing, it compares the ‘hybrid’ data-inspired structure with three more traditional structures (i.e. hierarchy, flexible/relaxed hierarchy, and anarchy/disorganization).
DARTS: modelling effects of shocks on global, regional, urban and rural food security
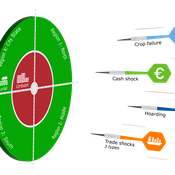
Geerten Hengeveld Hubert Fonteijn Pepijn van Oort | Published Tuesday, June 18, 2024Food trade networks represent a complex system where food is periodically produced in different regions of the world. Food is continuously stocked and traded. Food security in a globalised world is vulnerable to shocks. We present DARTS, a new agent based model that models monthly dynamics of food production, trade, stocking, consumption and food security for different interconnected world regions and a city state. Agents in different regions differ in their harvest seasons, wealth (rich and poor), degree of urbanisation and connection to domestic and global markets. DARTS was specifically designed to model direct and indirect effects of shocks in the food system. We introduce a new typology of 6 distinct shock types and analyse their impact on food security, modelling local and global effects and short term and longer term effects. An second important scientific novelty of the model is that DARTS can also model indirect effects of shocks (cascading in space and in time, lag effects due to trade and food stock buffering). A third important scientific novelty of the model is its’ capability of modelling food security at different scales, in which the rural/urban divide and differences in (intra-annually varying) production and trade connections play a key role. At the time of writing DARTS is yet insufficiently parameterised for accurate prediction for real world regions and cities. Simulations for a hypothetical in silico world with 3 regions and a city state show that DARTS can reproduce rich and complex dynamics with analogues in the real world. The scientific interest is more on deepening insight in process dynamics and chains of events that lead to ultimate shock effects on food security.
Critical Sustainability Transitions: Relaunching local agriculture after decline (Model code and description)
Pedro Lopez-Merino | Published Tuesday, April 30, 2024This model simulates the dynamics of agricultural land use change, specifically the transition between agricultural and non-agricultural land use in a spatial context. It explores the influence of various factors such as agricultural profitability, path dependency, and neighborhood effects on land use decisions.
The model operates on a grid of patches representing land parcels. Each patch can be in one of two states: exploited (green, representing agricultural land) or unexploited (brown, representing non-agricultural land). Agents (patches) transition between these states based on probabilistic rules. The main factors affecting these transitions are agricultural profitability, path dependency, and neighborhood effects.
-Agricultural Profitability: This factor is determined by the prob-agri function, which calculates the probability of a non-agricultural patch converting to agricultural based on income differences between agriculture and other sectors. -Path Dependency: Represented by the path-dependency parameter, it influences the likelihood of patches changing their state based on their current state. It’s a measure of inertia or resistance to change. -Neighborhood Effects: The neighborhood function calculates the number of exploited (agricultural) neighbors of a patch. This influences the decision of a patch to convert to agricultural land, representing the influence of surrounding land use on the decision-making process.
Displaying 10 of 41 results resilience clear search
