Our mission is to help computational modelers develop, document, and share their computational models in accordance with community standards and good open science and software engineering practices. Model authors can publish their model source code in the Computational Model Library with narrative documentation as well as metadata that supports open science and emerging norms that facilitate software citation, computational reproducibility / frictionless reuse, and interoperability. Model authors can also request private peer review of their computational models. Models that pass peer review receive a DOI once published.
All users of models published in the library must cite model authors when they use and benefit from their code.
Please check out our model publishing tutorial and feel free to contact us if you have any questions or concerns about publishing your model(s) in the Computational Model Library.
Displaying 5 of 5 results multivariate clear search
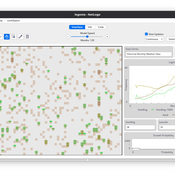
Logônia: Plant Growth Response Model in NetLogo
Daniel Vartanian Leandro Garcia Aline | Published Saturday, September 13, 2025 | Last modified Monday, July 13, 2026Logônia is a NetLogo model that simulates the growth response of a fictional plant, Logônia, under different climatic conditions. The model uses climate data from WorldClim 2.1 (Fick & Hijmans, 2017) and demonstrates how to integrate the LogoClim model through the LevelSpace extension.
The model was developed according to the FAIR principles for research software (Barker et al., 2022) and is openly available on the CoMSES Network and GitHub.
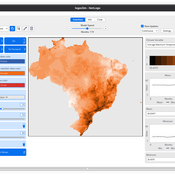
LogoClim: WorldClim in NetLogo
Daniel Vartanian Leandro Garcia Aline Martins de Carvalho Aline | Published Thursday, July 03, 2025 | Last modified Monday, July 13, 2026LogoClim is a NetLogo model designed to be integrated into other simulations through the LevelSpace extension (Hjorth et al., 2020), providing high resolution climate data from sources validated and used by the Intergovernmental Panel on Climate Change (IPCC).
The model simplifies and standardizes the integration of climate data into NetLogo, allowing researchers to focus their efforts on the model itself with the assurance of using reliable and widely recognized data. Although its main use is as a component of larger simulations, LogoClim also has its own graphical interface for monitoring and checking the datasets.
The climate data comes from the WorldClim 2.1 project (Fick & Hijmans, 2017), for which LogoClim works as an interface to NetLogo. The model supports all three WorldClim data series: (1) Historical Climate Data (1970 to 2000), with 12 monthly points for minimum, mean, and maximum temperature, precipitation, solar radiation, wind speed, vapor pressure, elevation, and bioclimatic variables; (2) Historical Monthly Weather Data (1951 to 2024), based on downscaling of CRU-TS-4.09, developed by the Climatic Research Unit at the University of East Anglia (Harris et al., 2020), with minimum and maximum temperature and total precipitation; and (3) Future Climate Data, based on downscaling climate projections derived from global climate models of the Coupled Model Intercomparison Project Phase 6 (CMIP6) (Eyring et al., 2016) for four future periods (2021 to 2040, 2041 to 2060, 2061 to 2080, and 2081 to 2100) and four scenarios based on the Shared Socioeconomic Pathways (SSPs 126, 245, 370, and 585), covering minimum and maximum temperature, total precipitation, and bioclimatic variables. All series are available at multiple spatial resolutions, from 10 minutes (about 340 km² at the equator) to 30 seconds (about 1 km² at the equator).
…
The doctrinal paradox in deliberative process and in majority voting
Sacha Ferrari | Published Monday, January 13, 2025This model proposes a new approach analyzing to the doctrinal paradox by considering a deliberative process (which can be represented by an agent-based model) in comparison with classical (binary) majority voting and an aggregation of (continuous) degrees of belief prior to majority voting. This model is a multivariate extension of the Hegselmann–Krause opinion dynamics model.
segregation model with multiple variables and explit spatiality
Andreas Koch | Published Wednesday, October 28, 2009 | Last modified Saturday, April 27, 2013This model is a more comprehensive version of the original model; descriptions and expanations are added
Socio-spatial segregation in Salzburg, Austria
Andreas Koch | Published Friday, September 25, 2009 | Last modified Saturday, April 27, 2013This is a first preliminary simulation model to model segregation in the city of Salzburg, Austria.