Population Genetics (2.0.0)
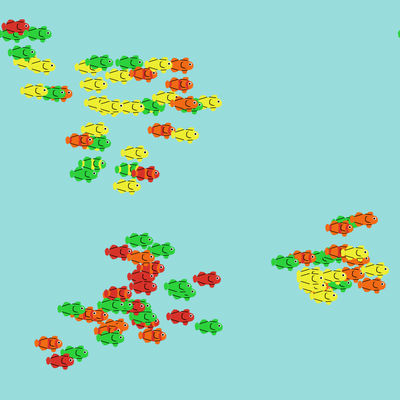
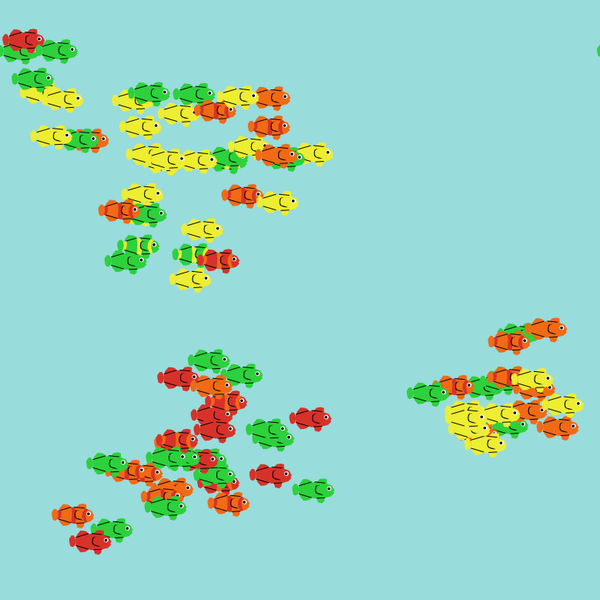
This model simulates how the mechanisms of biological evolution (genetic drift, gene flow, mutation, and natural selection) shape emergent evolutionary patterns. That is, how allele frequencies change in a population over generations and shape patterns of between- and within-population variation.
During a simulation, “students” control populations of fish via a HubNet Client and a “teacher” controls the environment via the HubNet Control Center. Teachers can set up to four alleles at the locus coding for color. A fish’s color phenotype is based on its genotype and the allele relationship set by parameters (i.e. dominant or recessive). The plots in the user interface show how the allele frequencies within and between populations change over generations.

Release Notes
Version 2.0.0 includes major updates to functionality and visuals: new fish graphics, easier parameter settings for alleles, plots that show within- and between-population variation, and the ability to allow continuous reproduction instead of by manual input only. Compatible with NetLogo 6.1.1.
Associated Publications
Dung, S. K., López, A., Barragan, E. L., Reyes, R. J., Thu, R., Castellanos, E., Catalan, F., Huerta-Sánchez, E. & Rohlfs, R. V. (2019). Illuminating Women’s Hidden Contribution to Historical Theoretical Population Genetics. Genetics, 211(2), 363-366.
This release is out-of-date. The latest version is
2.1.0
Population Genetics 2.0.0
Submitted by
Kristin Crouse
Published Feb 24, 2020
Last modified Sep 09, 2020
This model simulates how the mechanisms of biological evolution (genetic drift, gene flow, mutation, and natural selection) shape emergent evolutionary patterns. That is, how allele frequencies change in a population over generations and shape patterns of between- and within-population variation.
During a simulation, “students” control populations of fish via a HubNet Client and a “teacher” controls the environment via the HubNet Control Center. Teachers can set up to four alleles at the locus coding for color. A fish’s color phenotype is based on its genotype and the allele relationship set by parameters (i.e. dominant or recessive). The plots in the user interface show how the allele frequencies within and between populations change over generations.
Release Notes
Version 2.0.0 includes major updates to functionality and visuals: new fish graphics, easier parameter settings for alleles, plots that show within- and between-population variation, and the ability to allow continuous reproduction instead of by manual input only. Compatible with NetLogo 6.1.1.

